
 Yahoo Finance
 Here's How P/E Ratios Can Help Us Understand Shore Bancshares, Inc. (NASDAQ:SHBI)

The goal of this article is to teach you how to use price to earnings ratios (P/E ratios). We'll show how you can use Shore Bancshares, Inc.'s (NASDAQ:SHBI) P/E ratio to inform your assessment of the investment opportunity. What is Shore Bancshares's P/E ratio? Well, based on the last twelve months it is 12.25. That is equivalent to an earnings yield of about 8.2%.
Check out our latest analysis for Shore Bancshares
How Do I Calculate A Price To Earnings Ratio?
The formula for P/E is:
Price to Earnings Ratio = Share Price ÷ Earnings per Share (EPS)
Or for Shore Bancshares:
P/E of 12.25 = $15.52 ÷ $1.27 (Based on the trailing twelve months to June 2019.)
Is A High Price-to-Earnings Ratio Good?
A higher P/E ratio implies that investors pay a higher price for the earning power of the business. All else being equal, it's better to pay a low price -- but as Warren Buffett said, 'It's far better to buy a wonderful company at a fair price than a fair company at a wonderful price.
Does Shore Bancshares Have A Relatively High Or Low P/E For Its Industry?
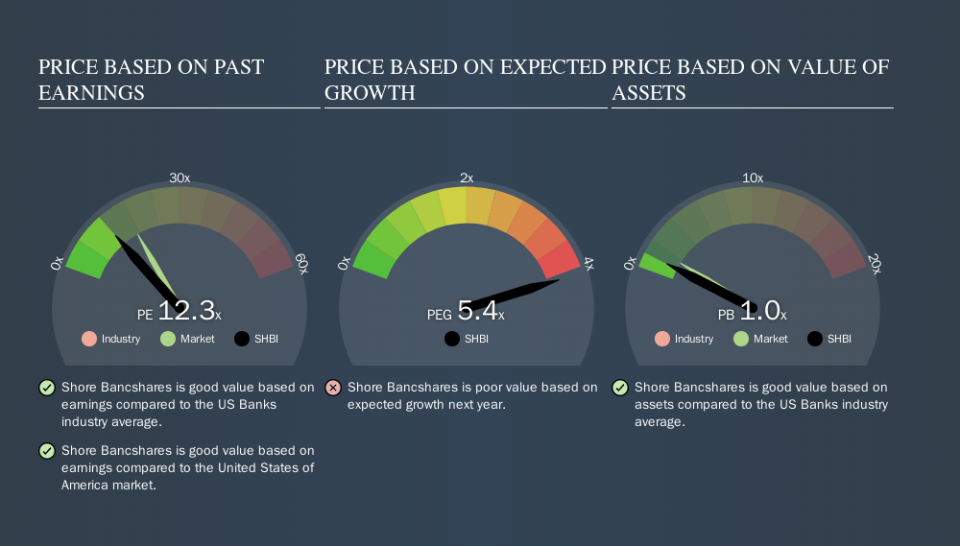
One good way to get a quick read on what market participants expect of a company is to look at its P/E ratio. You can see in the image below that the average P/E (12.4) for companies in the banks industry is roughly the same as Shore Bancshares's P/E.
Shore Bancshares's P/E tells us that market participants think its prospects are roughly in line with its industry. So if Shore Bancshares actually outperforms its peers going forward, that should be a positive for the share price. Further research into factors such as insider buying and selling, could help you form your own view on whether that is likely.
How Growth Rates Impact P/E Ratios
Earnings growth rates have a big influence on P/E ratios. That's because companies that grow earnings per share quickly will rapidly increase the 'E' in the equation. That means unless the share price increases, the P/E will reduce in a few years. So while a stock may look expensive based on past earnings, it could be cheap based on future earnings.
Shore Bancshares increased earnings per share by a whopping 37% last year. And its annual EPS growth rate over 3 years is 22%. I'd therefore be a little surprised if its P/E ratio was not relatively high.
Don't Forget: The P/E Does Not Account For Debt or Bank Deposits
Don't forget that the P/E ratio considers market capitalization. That means it doesn't take debt or cash into account. In theory, a company can lower its future P/E ratio by using cash or debt to invest in growth.
Such spending might be good or bad, overall, but the key point here is that you need to look at debt to understand the P/E ratio in context.
So What Does Shore Bancshares's Balance Sheet Tell Us?
Net debt totals just 0.6% of Shore Bancshares's market cap. The market might award it a higher P/E ratio if it had net cash, but its unlikely this low level of net borrowing is having a big impact on the P/E multiple.
The Bottom Line On Shore Bancshares's P/E Ratio
Shore Bancshares trades on a P/E ratio of 12.3, which is below the US market average of 17.4. The EPS growth last year was strong, and debt levels are quite reasonable. If the company can continue to grow earnings, then the current P/E may be unjustifiably low.
Investors have an opportunity when market expectations about a stock are wrong. If the reality for a company is not as bad as the P/E ratio indicates, then the share price should increase as the market realizes this. So this free visualization of the analyst consensus on future earnings could help you make the right decision about whether to buy, sell, or hold.
Of course, you might find a fantastic investment by looking at a few good candidates. So take a peek at this free list of companies with modest (or no) debt, trading on a P/E below 20.
We aim to bring you long-term focused research analysis driven by fundamental data. Note that our analysis may not factor in the latest price-sensitive company announcements or qualitative material.
If you spot an error that warrants correction, please contact the editor at editorial-team@simplywallst.com. This article by Simply Wall St is general in nature. It does not constitute a recommendation to buy or sell any stock, and does not take account of your objectives, or your financial situation. Simply Wall St has no position in the stocks mentioned. Thank you for reading.
