
 Yahoo Finance
 Here's How P/E Ratios Can Help Us Understand Graham Holdings Company (NYSE:GHC)

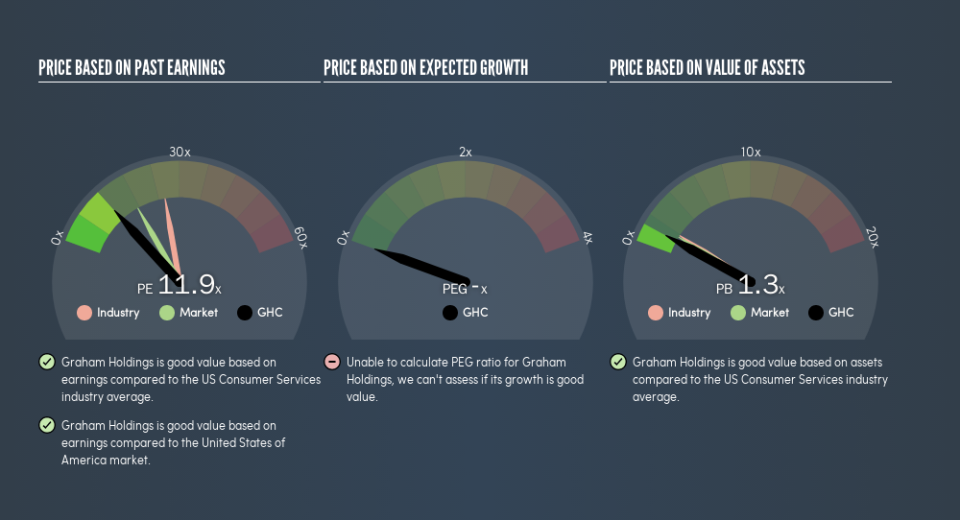
The goal of this article is to teach you how to use price to earnings ratios (P/E ratios). We'll look at Graham Holdings Company's (NYSE:GHC) P/E ratio and reflect on what it tells us about the company's share price. What is Graham Holdings's P/E ratio? Well, based on the last twelve months it is 11.92. That corresponds to an earnings yield of approximately 8.4%.
Check out our latest analysis for Graham Holdings
How Do You Calculate A P/E Ratio?
The formula for price to earnings is:
Price to Earnings Ratio = Share Price ÷ Earnings per Share (EPS)
Or for Graham Holdings:
P/E of 11.92 = $718.51 ÷ $60.3 (Based on the trailing twelve months to June 2019.)
Is A High Price-to-Earnings Ratio Good?
A higher P/E ratio means that investors are paying a higher price for each $1 of company earnings. That isn't necessarily good or bad, but a high P/E implies relatively high expectations of what a company can achieve in the future.
How Does Graham Holdings's P/E Ratio Compare To Its Peers?
The P/E ratio indicates whether the market has higher or lower expectations of a company. The image below shows that Graham Holdings has a lower P/E than the average (25.8) P/E for companies in the consumer services industry.
Its relatively low P/E ratio indicates that Graham Holdings shareholders think it will struggle to do as well as other companies in its industry classification. While current expectations are low, the stock could be undervalued if the situation is better than the market assumes. It is arguably worth checking if insiders are buying shares, because that might imply they believe the stock is undervalued.
How Growth Rates Impact P/E Ratios
Earnings growth rates have a big influence on P/E ratios. When earnings grow, the 'E' increases, over time. And in that case, the P/E ratio itself will drop rather quickly. Then, a lower P/E should attract more buyers, pushing the share price up.
Graham Holdings had pretty flat EPS growth in the last year. And it has shrunk its earnings per share by 4.2% per year over the last five years. So it would be surprising to see a high P/E.
A Limitation: P/E Ratios Ignore Debt and Cash In The Bank
The 'Price' in P/E reflects the market capitalization of the company. In other words, it does not consider any debt or cash that the company may have on the balance sheet. In theory, a company can lower its future P/E ratio by using cash or debt to invest in growth.
Such expenditure might be good or bad, in the long term, but the point here is that the balance sheet is not reflected by this ratio.
Is Debt Impacting Graham Holdings's P/E?
Since Graham Holdings holds net cash of US$152m, it can spend on growth, justifying a higher P/E ratio than otherwise.
The Verdict On Graham Holdings's P/E Ratio
Graham Holdings trades on a P/E ratio of 11.9, which is below the US market average of 17.4. Earnings improved over the last year. And the healthy balance sheet means the company can sustain growth while the P/E suggests shareholders don't think it will.
Investors should be looking to buy stocks that the market is wrong about. As value investor Benjamin Graham famously said, 'In the short run, the market is a voting machine but in the long run, it is a weighing machine.' Although we don't have analyst forecasts, you might want to assess this data-rich visualization of earnings, revenue and cash flow.
Of course, you might find a fantastic investment by looking at a few good candidates. So take a peek at this free list of companies with modest (or no) debt, trading on a P/E below 20.
We aim to bring you long-term focused research analysis driven by fundamental data. Note that our analysis may not factor in the latest price-sensitive company announcements or qualitative material.
If you spot an error that warrants correction, please contact the editor at editorial-team@simplywallst.com. This article by Simply Wall St is general in nature. It does not constitute a recommendation to buy or sell any stock, and does not take account of your objectives, or your financial situation. Simply Wall St has no position in the stocks mentioned. Thank you for reading.
