
 Yahoo Finance
 Here's What To Make Of National Instruments' (NASDAQ:NATI) Decelerating Rates Of Return
There are a few key trends to look for if we want to identify the next multi-bagger. In a perfect world, we'd like to see a company investing more capital into its business and ideally the returns earned from that capital are also increasing. Ultimately, this demonstrates that it's a business that is reinvesting profits at increasing rates of return. Having said that, from a first glance at National Instruments (NASDAQ:NATI) we aren't jumping out of our chairs at how returns are trending, but let's have a deeper look.
What is Return On Capital Employed (ROCE)?
For those who don't know, ROCE is a measure of a company's yearly pre-tax profit (its return), relative to the capital employed in the business. Analysts use this formula to calculate it for National Instruments:
Return on Capital Employed = Earnings Before Interest and Tax (EBIT) ÷ (Total Assets - Current Liabilities)
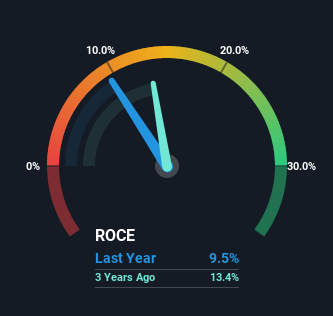
0.095 = US$160m ÷ (US$2.1b - US$390m) (Based on the trailing twelve months to March 2022).
Thus, National Instruments has an ROCE of 9.5%. In absolute terms, that's a low return but it's around the Electronic industry average of 11%.
Check out our latest analysis for National Instruments
Above you can see how the current ROCE for National Instruments compares to its prior returns on capital, but there's only so much you can tell from the past. If you'd like to see what analysts are forecasting going forward, you should check out our free report for National Instruments.
How Are Returns Trending?
In terms of National Instruments' historical ROCE trend, it doesn't exactly demand attention. The company has consistently earned 9.5% for the last five years, and the capital employed within the business has risen 37% in that time. Given the company has increased the amount of capital employed, it appears the investments that have been made simply don't provide a high return on capital.
The Bottom Line
In summary, National Instruments has simply been reinvesting capital and generating the same low rate of return as before. And investors may be recognizing these trends since the stock has only returned a total of 1.7% to shareholders over the last five years. As a result, if you're hunting for a multi-bagger, we think you'd have more luck elsewhere.
Since virtually every company faces some risks, it's worth knowing what they are, and we've spotted 2 warning signs for National Instruments (of which 1 doesn't sit too well with us!) that you should know about.
If you want to search for solid companies with great earnings, check out this free list of companies with good balance sheets and impressive returns on equity.
Have feedback on this article? Concerned about the content? Get in touch with us directly. Alternatively, email editorial-team (at) simplywallst.com.
This article by Simply Wall St is general in nature. We provide commentary based on historical data and analyst forecasts only using an unbiased methodology and our articles are not intended to be financial advice. It does not constitute a recommendation to buy or sell any stock, and does not take account of your objectives, or your financial situation. We aim to bring you long-term focused analysis driven by fundamental data. Note that our analysis may not factor in the latest price-sensitive company announcements or qualitative material. Simply Wall St has no position in any stocks mentioned.
