
 Yahoo Finance
 Here's What FLIR Systems, Inc.'s (NASDAQ:FLIR) P/E Is Telling Us

Today, we'll introduce the concept of the P/E ratio for those who are learning about investing. To keep it practical, we'll show how FLIR Systems, Inc.'s (NASDAQ:FLIR) P/E ratio could help you assess the value on offer. Looking at earnings over the last twelve months, FLIR Systems has a P/E ratio of 25.18. That corresponds to an earnings yield of approximately 4.0%.
Check out our latest analysis for FLIR Systems
How Do You Calculate A P/E Ratio?
The formula for price to earnings is:
Price to Earnings Ratio = Share Price ÷ Earnings per Share (EPS)
Or for FLIR Systems:
P/E of 25.18 = $51.56 ÷ $2.05 (Based on the year to June 2019.)
Is A High Price-to-Earnings Ratio Good?
A higher P/E ratio means that investors are paying a higher price for each $1 of company earnings. All else being equal, it's better to pay a low price -- but as Warren Buffett said, 'It's far better to buy a wonderful company at a fair price than a fair company at a wonderful price.
How Does FLIR Systems's P/E Ratio Compare To Its Peers?
The P/E ratio indicates whether the market has higher or lower expectations of a company. You can see in the image below that the average P/E (20.3) for companies in the electronic industry is lower than FLIR Systems's P/E.
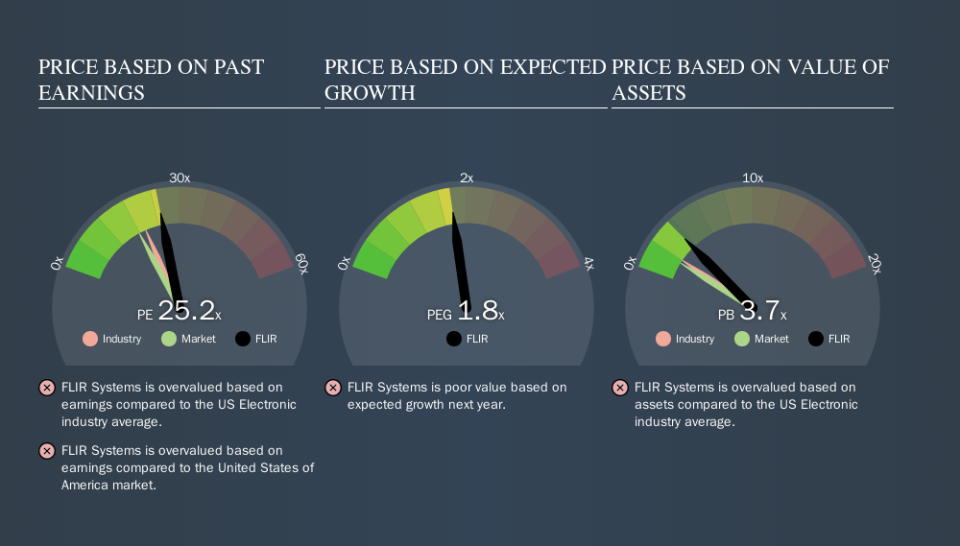
That means that the market expects FLIR Systems will outperform other companies in its industry. Shareholders are clearly optimistic, but the future is always uncertain. So investors should always consider the P/E ratio alongside other factors, such as whether company directors have been buying shares.
How Growth Rates Impact P/E Ratios
P/E ratios primarily reflect market expectations around earnings growth rates. That's because companies that grow earnings per share quickly will rapidly increase the 'E' in the equation. That means even if the current P/E is high, it will reduce over time if the share price stays flat. So while a stock may look expensive based on past earnings, it could be cheap based on future earnings.
FLIR Systems's earnings made like a rocket, taking off 128% last year. Having said that, if we look back three years, EPS growth has averaged a comparatively less impressive 14%.
A Limitation: P/E Ratios Ignore Debt and Cash In The Bank
The 'Price' in P/E reflects the market capitalization of the company. Thus, the metric does not reflect cash or debt held by the company. Hypothetically, a company could reduce its future P/E ratio by spending its cash (or taking on debt) to achieve higher earnings.
While growth expenditure doesn't always pay off, the point is that it is a good option to have; but one that the P/E ratio ignores.
FLIR Systems's Balance Sheet
FLIR Systems's net debt is 7.1% of its market cap. It would probably trade on a higher P/E ratio if it had a lot of cash, but I doubt it is having a big impact.
The Verdict On FLIR Systems's P/E Ratio
FLIR Systems has a P/E of 25.2. That's higher than the average in its market, which is 17.8. While the company does use modest debt, its recent earnings growth is superb. So to be frank we are not surprised it has a high P/E ratio.
Investors have an opportunity when market expectations about a stock are wrong. People often underestimate remarkable growth -- so investors can make money when fast growth is not fully appreciated. So this free visualization of the analyst consensus on future earnings could help you make the right decision about whether to buy, sell, or hold.
You might be able to find a better buy than FLIR Systems. If you want a selection of possible winners, check out this free list of interesting companies that trade on a P/E below 20 (but have proven they can grow earnings).
We aim to bring you long-term focused research analysis driven by fundamental data. Note that our analysis may not factor in the latest price-sensitive company announcements or qualitative material.
If you spot an error that warrants correction, please contact the editor at editorial-team@simplywallst.com. This article by Simply Wall St is general in nature. It does not constitute a recommendation to buy or sell any stock, and does not take account of your objectives, or your financial situation. Simply Wall St has no position in the stocks mentioned. Thank you for reading.
