
 Yahoo Finance
 Here's What Cameco Corporation's (TSE:CCO) P/E Is Telling Us

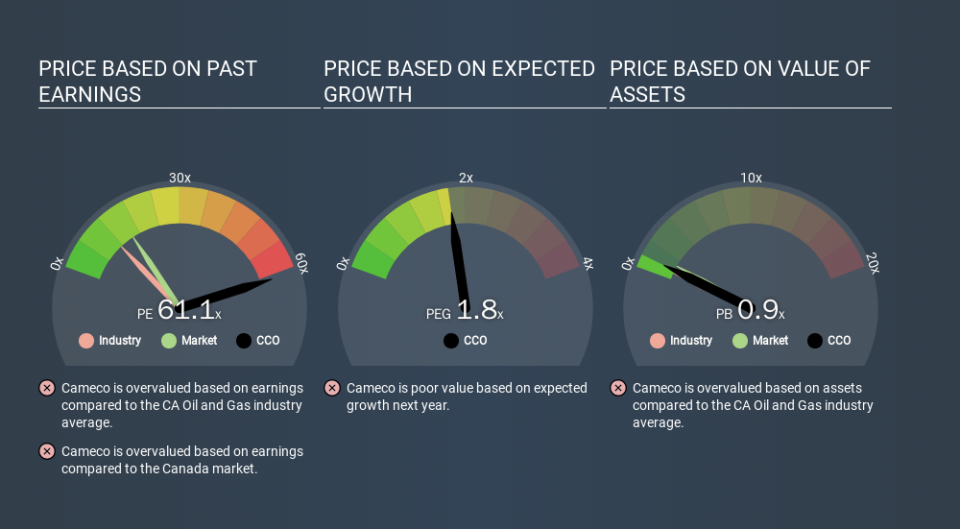
Today, we'll introduce the concept of the P/E ratio for those who are learning about investing. We'll show how you can use Cameco Corporation's (TSE:CCO) P/E ratio to inform your assessment of the investment opportunity. Looking at earnings over the last twelve months, Cameco has a P/E ratio of 61.08. In other words, at today's prices, investors are paying CA$61.08 for every CA$1 in prior year profit.
Check out our latest analysis for Cameco
How Do I Calculate A Price To Earnings Ratio?
The formula for price to earnings is:
Price to Earnings Ratio = Share Price ÷ Earnings per Share (EPS)
Or for Cameco:
P/E of 61.08 = CAD11.42 ÷ CAD0.19 (Based on the trailing twelve months to December 2019.)
Is A High P/E Ratio Good?
The higher the P/E ratio, the higher the price tag of a business, relative to its trailing earnings. That isn't necessarily good or bad, but a high P/E implies relatively high expectations of what a company can achieve in the future.
How Does Cameco's P/E Ratio Compare To Its Peers?
One good way to get a quick read on what market participants expect of a company is to look at its P/E ratio. You can see in the image below that the average P/E (11.4) for companies in the oil and gas industry is a lot lower than Cameco's P/E.
That means that the market expects Cameco will outperform other companies in its industry. The market is optimistic about the future, but that doesn't guarantee future growth. So investors should always consider the P/E ratio alongside other factors, such as whether company directors have been buying shares.
How Growth Rates Impact P/E Ratios
Generally speaking the rate of earnings growth has a profound impact on a company's P/E multiple. If earnings are growing quickly, then the 'E' in the equation will increase faster than it would otherwise. That means unless the share price increases, the P/E will reduce in a few years. Then, a lower P/E should attract more buyers, pushing the share price up.
Cameco's earnings per share fell by 56% in the last twelve months. But over the longer term (5 years) earnings per share have increased by 5.0%.
Remember: P/E Ratios Don't Consider The Balance Sheet
The 'Price' in P/E reflects the market capitalization of the company. That means it doesn't take debt or cash into account. In theory, a company can lower its future P/E ratio by using cash or debt to invest in growth.
Such spending might be good or bad, overall, but the key point here is that you need to look at debt to understand the P/E ratio in context.
How Does Cameco's Debt Impact Its P/E Ratio?
Since Cameco holds net cash of CA$66m, it can spend on growth, justifying a higher P/E ratio than otherwise.
The Verdict On Cameco's P/E Ratio
With a P/E ratio of 61.1, Cameco is expected to grow earnings very strongly in the years to come. The recent drop in earnings per share might keep value investors away, but the relatively strong balance sheet will allow the company time to invest in growth. Clearly, the high P/E indicates shareholders think it will!
Investors have an opportunity when market expectations about a stock are wrong. As value investor Benjamin Graham famously said, 'In the short run, the market is a voting machine but in the long run, it is a weighing machine. So this free report on the analyst consensus forecasts could help you make a master move on this stock.
Of course, you might find a fantastic investment by looking at a few good candidates. So take a peek at this free list of companies with modest (or no) debt, trading on a P/E below 20.
If you spot an error that warrants correction, please contact the editor at editorial-team@simplywallst.com. This article by Simply Wall St is general in nature. It does not constitute a recommendation to buy or sell any stock, and does not take account of your objectives, or your financial situation. Simply Wall St has no position in the stocks mentioned.
We aim to bring you long-term focused research analysis driven by fundamental data. Note that our analysis may not factor in the latest price-sensitive company announcements or qualitative material. Thank you for reading.