
 Yahoo Finance
 Here's What Bonterra Energy Corp.'s (TSE:BNE) P/E Is Telling Us

Want to participate in a research study? Help shape the future of investing tools and earn a $60 gift card!
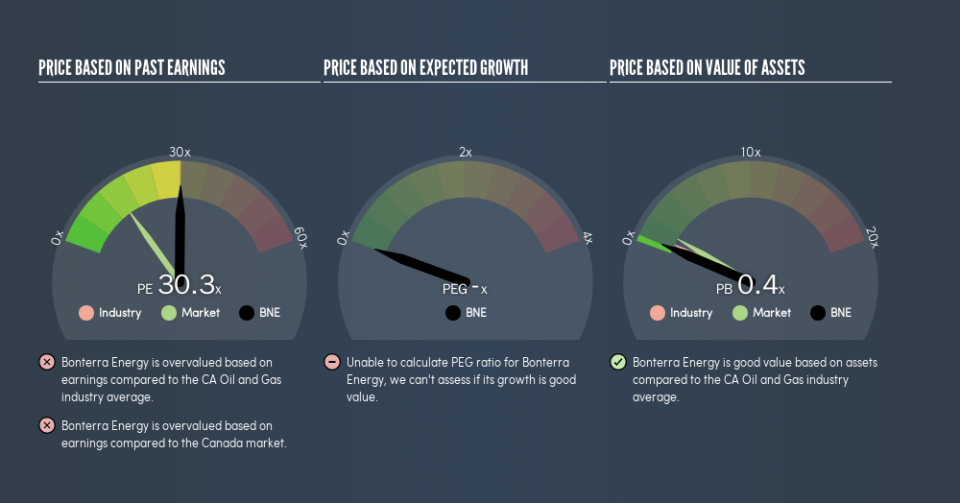
This article is for investors who would like to improve their understanding of price to earnings ratios (P/E ratios). We'll look at Bonterra Energy Corp.'s (TSE:BNE) P/E ratio and reflect on what it tells us about the company's share price. Bonterra Energy has a P/E ratio of 30.27, based on the last twelve months. That corresponds to an earnings yield of approximately 3.3%.
View our latest analysis for Bonterra Energy
How Do You Calculate A P/E Ratio?
The formula for P/E is:
Price to Earnings Ratio = Share Price ÷ Earnings per Share (EPS)
Or for Bonterra Energy:
P/E of 30.27 = CA$6.51 ÷ CA$0.22 (Based on the trailing twelve months to December 2018.)
Is A High Price-to-Earnings Ratio Good?
A higher P/E ratio means that buyers have to pay a higher price for each CA$1 the company has earned over the last year. That isn't necessarily good or bad, but a high P/E implies relatively high expectations of what a company can achieve in the future.
How Growth Rates Impact P/E Ratios
P/E ratios primarily reflect market expectations around earnings growth rates. Earnings growth means that in the future the 'E' will be higher. That means even if the current P/E is high, it will reduce over time if the share price stays flat. A lower P/E should indicate the stock is cheap relative to others -- and that may attract buyers.
Notably, Bonterra Energy grew EPS by a whopping 186% in the last year. And it has improved its earnings per share by 102% per year over the last three years. With that performance, I would expect it to have an above average P/E ratio. In contrast, EPS has decreased by 47%, annually, over 5 years.
How Does Bonterra Energy's P/E Ratio Compare To Its Peers?
We can get an indication of market expectations by looking at the P/E ratio. As you can see below, Bonterra Energy has a higher P/E than the average company (15) in the oil and gas industry.
Its relatively high P/E ratio indicates that Bonterra Energy shareholders think it will perform better than other companies in its industry classification. Clearly the market expects growth, but it isn't guaranteed. So further research is always essential. I often monitor director buying and selling.
Remember: P/E Ratios Don't Consider The Balance Sheet
Don't forget that the P/E ratio considers market capitalization. Thus, the metric does not reflect cash or debt held by the company. Hypothetically, a company could reduce its future P/E ratio by spending its cash (or taking on debt) to achieve higher earnings.
Such spending might be good or bad, overall, but the key point here is that you need to look at debt to understand the P/E ratio in context.
Is Debt Impacting Bonterra Energy's P/E?
Bonterra Energy has net debt worth a very significant 147% of its market capitalization. If you want to compare its P/E ratio to other companies, you must keep in mind that these debt levels would usually warrant a relatively low P/E.
The Bottom Line On Bonterra Energy's P/E Ratio
Bonterra Energy's P/E is 30.3 which is above average (15.1) in the CA market. It has already proven it can grow earnings, but the debt levels mean it faces some risks. It seems the market believes growth will continue, judging by the P/E ratio.
When the market is wrong about a stock, it gives savvy investors an opportunity. People often underestimate remarkable growth -- so investors can make money when fast growth is not fully appreciated. So this free visual report on analyst forecasts could hold the key to an excellent investment decision.
But note: Bonterra Energy may not be the best stock to buy. So take a peek at this free list of interesting companies with strong recent earnings growth (and a P/E ratio below 20).
We aim to bring you long-term focused research analysis driven by fundamental data. Note that our analysis may not factor in the latest price-sensitive company announcements or qualitative material.
If you spot an error that warrants correction, please contact the editor at editorial-team@simplywallst.com. This article by Simply Wall St is general in nature. It does not constitute a recommendation to buy or sell any stock, and does not take account of your objectives, or your financial situation. Simply Wall St has no position in the stocks mentioned. Thank you for reading.
