
 Yahoo Finance
 Hemisphere Energy (CVE:HME) Shareholders Will Want The ROCE Trajectory To Continue
To find a multi-bagger stock, what are the underlying trends we should look for in a business? Firstly, we'll want to see a proven return on capital employed (ROCE) that is increasing, and secondly, an expanding base of capital employed. Basically this means that a company has profitable initiatives that it can continue to reinvest in, which is a trait of a compounding machine. Speaking of which, we noticed some great changes in Hemisphere Energy's (CVE:HME) returns on capital, so let's have a look.
Understanding Return On Capital Employed (ROCE)
For those who don't know, ROCE is a measure of a company's yearly pre-tax profit (its return), relative to the capital employed in the business. To calculate this metric for Hemisphere Energy, this is the formula:
Return on Capital Employed = Earnings Before Interest and Tax (EBIT) ÷ (Total Assets - Current Liabilities)
0.12 = CA$6.7m ÷ (CA$56m - CA$1.2m) (Based on the trailing twelve months to September 2020).
So, Hemisphere Energy has an ROCE of 12%. In absolute terms, that's a satisfactory return, but compared to the Oil and Gas industry average of 5.5% it's much better.
Check out our latest analysis for Hemisphere Energy
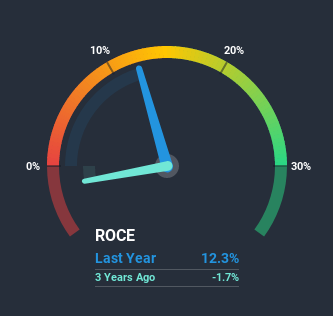
Historical performance is a great place to start when researching a stock so above you can see the gauge for Hemisphere Energy's ROCE against it's prior returns. If you're interested in investigating Hemisphere Energy's past further, check out this free graph of past earnings, revenue and cash flow.
What Does the ROCE Trend For Hemisphere Energy Tell Us?
We're delighted to see that Hemisphere Energy is reaping rewards from its investments and is now generating some pre-tax profits. Shareholders would no doubt be pleased with this because the business was loss-making five years ago but is is now generating 12% on its capital. And unsurprisingly, like most companies trying to break into the black, Hemisphere Energy is utilizing 80% more capital than it was five years ago. This can indicate that there's plenty of opportunities to invest capital internally and at ever higher rates, both common traits of a multi-bagger.
In another part of our analysis, we noticed that the company's ratio of current liabilities to total assets decreased to 2.1%, which broadly means the business is relying less on its suppliers or short-term creditors to fund its operations. Therefore we can rest assured that the growth in ROCE is a result of the business' fundamental improvements, rather than a cooking class featuring this company's books.
The Bottom Line On Hemisphere Energy's ROCE
Long story short, we're delighted to see that Hemisphere Energy's reinvestment activities have paid off and the company is now profitable. And a remarkable 143% total return over the last five years tells us that investors are expecting more good things to come in the future. Therefore, we think it would be worth your time to check if these trends are going to continue.
One more thing, we've spotted 2 warning signs facing Hemisphere Energy that you might find interesting.
While Hemisphere Energy isn't earning the highest return, check out this free list of companies that are earning high returns on equity with solid balance sheets.
This article by Simply Wall St is general in nature. It does not constitute a recommendation to buy or sell any stock, and does not take account of your objectives, or your financial situation. We aim to bring you long-term focused analysis driven by fundamental data. Note that our analysis may not factor in the latest price-sensitive company announcements or qualitative material. Simply Wall St has no position in any stocks mentioned.
Have feedback on this article? Concerned about the content? Get in touch with us directly. Alternatively, email editorial-team (at) simplywallst.com.
