
 Yahoo Finance
 Helix Energy Solutions Group, Inc. (NYSE:HLX) Might Not Be A Great Investment

Today we'll look at Helix Energy Solutions Group, Inc. (NYSE:HLX) and reflect on its potential as an investment. To be precise, we'll consider its Return On Capital Employed (ROCE), as that will inform our view of the quality of the business.
First, we'll go over how we calculate ROCE. Then we'll compare its ROCE to similar companies. And finally, we'll look at how its current liabilities are impacting its ROCE.
Understanding Return On Capital Employed (ROCE)
ROCE is a measure of a company's yearly pre-tax profit (its return), relative to the capital employed in the business. In general, businesses with a higher ROCE are usually better quality. In brief, it is a useful tool, but it is not without drawbacks. Author Edwin Whiting says to be careful when comparing the ROCE of different businesses, since 'No two businesses are exactly alike.
So, How Do We Calculate ROCE?
Analysts use this formula to calculate return on capital employed:
Return on Capital Employed = Earnings Before Interest and Tax (EBIT) ÷ (Total Assets - Current Liabilities)
Or for Helix Energy Solutions Group:
0.022 = US$51m ÷ (US$2.6b - US$333m) (Based on the trailing twelve months to June 2019.)
Therefore, Helix Energy Solutions Group has an ROCE of 2.2%.
See our latest analysis for Helix Energy Solutions Group
Is Helix Energy Solutions Group's ROCE Good?
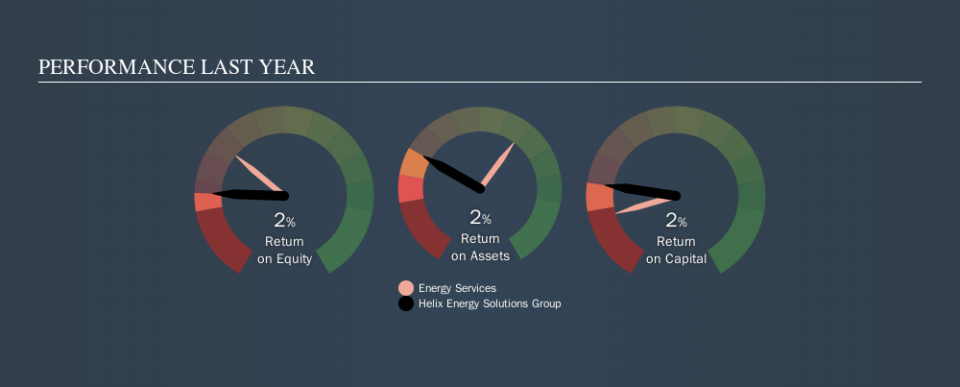
One way to assess ROCE is to compare similar companies. In this analysis, Helix Energy Solutions Group's ROCE appears meaningfully below the 9.8% average reported by the Energy Services industry. This performance is not ideal, as it suggests the company may not be deploying its capital as effectively as some competitors. Putting aside Helix Energy Solutions Group's performance relative to its industry, its ROCE in absolute terms is poor - considering the risk of owning stocks compared to government bonds. It is likely that there are more attractive prospects out there.
Helix Energy Solutions Group delivered an ROCE of 2.2%, which is better than 3 years ago, as was making losses back then. That suggests the business has returned to profitability. You can click on the image below to see (in greater detail) how Helix Energy Solutions Group's past growth compares to other companies.
When considering ROCE, bear in mind that it reflects the past and does not necessarily predict the future. Companies in cyclical industries can be difficult to understand using ROCE, as returns typically look high during boom times, and low during busts. ROCE is only a point-in-time measure. We note Helix Energy Solutions Group could be considered a cyclical business. What happens in the future is pretty important for investors, so we have prepared a free report on analyst forecasts for Helix Energy Solutions Group.
Helix Energy Solutions Group's Current Liabilities And Their Impact On Its ROCE
Current liabilities are short term bills and invoices that need to be paid in 12 months or less. Due to the way ROCE is calculated, a high level of current liabilities makes a company look as though it has less capital employed, and thus can (sometimes unfairly) boost the ROCE. To check the impact of this, we calculate if a company has high current liabilities relative to its total assets.
Helix Energy Solutions Group has total assets of US$2.6b and current liabilities of US$333m. As a result, its current liabilities are equal to approximately 13% of its total assets. This is not a high level of current liabilities, which would not boost the ROCE by much.
What We Can Learn From Helix Energy Solutions Group's ROCE
That's not a bad thing, however Helix Energy Solutions Group has a weak ROCE and may not be an attractive investment. Of course, you might find a fantastic investment by looking at a few good candidates. So take a peek at this free list of companies with modest (or no) debt, trading on a P/E below 20.
I will like Helix Energy Solutions Group better if I see some big insider buys. While we wait, check out this free list of growing companies with considerable, recent, insider buying.
We aim to bring you long-term focused research analysis driven by fundamental data. Note that our analysis may not factor in the latest price-sensitive company announcements or qualitative material.
If you spot an error that warrants correction, please contact the editor at editorial-team@simplywallst.com. This article by Simply Wall St is general in nature. It does not constitute a recommendation to buy or sell any stock, and does not take account of your objectives, or your financial situation. Simply Wall St has no position in the stocks mentioned. Thank you for reading.
