
 Yahoo Finance
 Is Heineken N.V. (AMS:HEIA) A Smart Choice For Dividend Investors?

Dividend paying stocks like Heineken N.V. (AMS:HEIA) tend to be popular with investors, and for good reason - some research suggests a significant amount of all stock market returns come from reinvested dividends. Unfortunately, it's common for investors to be enticed in by the seemingly attractive yield, and lose money when the company has to cut its dividend payments.
While Heineken's 1.7% dividend yield is not the highest, we think its lengthy payment history is quite interesting. Some simple research can reduce the risk of buying Heineken for its dividend - read on to learn more.
Click the interactive chart for our full dividend analysis
Payout ratios
Companies (usually) pay dividends out of their earnings. If a company is paying more than it earns, the dividend might have to be cut. Comparing dividend payments to a company's net profit after tax is a simple way of reality-checking whether a dividend is sustainable. Heineken paid out 50% of its profit as dividends, over the trailing twelve month period. A medium payout ratio strikes a good balance between paying dividends, and keeping enough back to invest in the business. Plus, there is room to increase the payout ratio over time.
Another important check we do is to see if the free cash flow generated is sufficient to pay the dividend. Heineken paid out 55% of its free cash flow last year, which is acceptable, but is starting to limit the amount of earnings that can be reinvested into the business. It's encouraging to see that the dividend is covered by both profit and cash flow. This generally suggests the dividend is sustainable, as long as earnings don't drop precipitously.
Is Heineken's Balance Sheet Risky?
As Heineken has a meaningful amount of debt, we need to check its balance sheet to see if the company might have debt risks. A rough way to check this is with these two simple ratios: a) net debt divided by EBITDA (earnings before interest, tax, depreciation and amortisation), and b) net interest cover. Net debt to EBITDA measures total debt load relative to company earnings (lower = less debt), while net interest cover measures the ability to pay interest on the debt (higher = greater ability to pay interest costs). With net debt of 2.94 times its EBITDA, Heineken's debt burden is within a normal range for most listed companies.
Net interest cover can be calculated by dividing earnings before interest and tax (EBIT) by the company's net interest expense. Net interest cover of 8.16 times its interest expense appears reasonable for Heineken, although we're conscious that even high interest cover doesn't make a company bulletproof.
Consider getting our latest analysis on Heineken's financial position here.
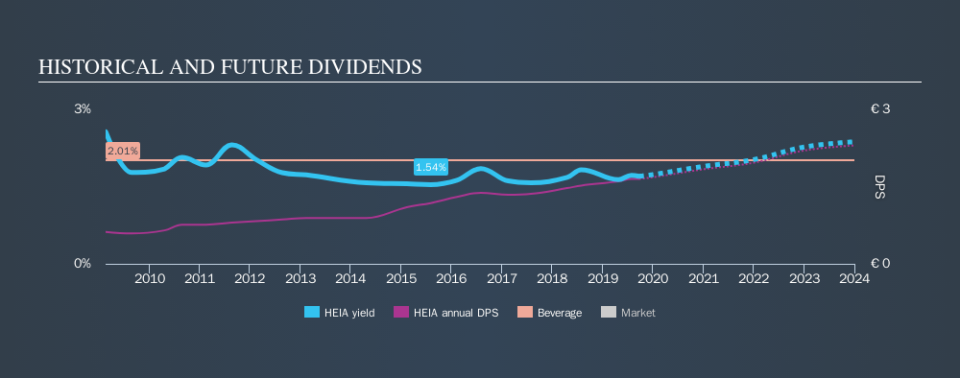
Dividend Volatility
One of the major risks of relying on dividend income, is the potential for a company to struggle financially and cut its dividend. Not only is your income cut, but the value of your investment declines as well - nasty. Heineken has been paying dividends for a long time, but for the purpose of this analysis, we only examine the past 10 years of payments. During this period the dividend has been stable, which could imply the business could have relatively consistent earnings power. During the past ten-year period, the first annual payment was €0.62 in 2009, compared to €1.65 last year. Dividends per share have grown at approximately 10% per year over this time.
Dividends have been growing pretty quickly, and even more impressively, they haven't experienced any notable falls during this period.
Dividend Growth Potential
While dividend payments have been relatively reliable, it would also be nice if earnings per share (EPS) were growing, as this is essential to maintaining the dividend's purchasing power over the long term. Earnings have grown at around 6.9% a year for the past five years, which is better than seeing them shrink! It's good to see decent earnings growth and a low payout ratio. Companies with these characteristics often display the fastest dividend growth over the long term - assuming earnings can be maintained, of course.
Conclusion
When we look at a dividend stock, we need to form a judgement on whether the dividend will grow, if the company is able to maintain it in a wide range of economic circumstances, and if the dividend payout is sustainable. Firstly, we like that Heineken pays out a low fraction of earnings. It pays out a higher percentage of its cashflow, although this is within acceptable bounds. Second, earnings growth has been mediocre, but at least the dividends have been relatively stable. Overall we think Heineken is an interesting dividend stock, although it could be better.
Companies that are growing earnings tend to be the best dividend stocks over the long term. See what the 20 analysts we track are forecasting for Heineken for free with public analyst estimates for the company.
Looking for more high-yielding dividend ideas? Try our curated list of dividend stocks with a yield above 3%.
We aim to bring you long-term focused research analysis driven by fundamental data. Note that our analysis may not factor in the latest price-sensitive company announcements or qualitative material.
If you spot an error that warrants correction, please contact the editor at editorial-team@simplywallst.com. This article by Simply Wall St is general in nature. It does not constitute a recommendation to buy or sell any stock, and does not take account of your objectives, or your financial situation. Simply Wall St has no position in the stocks mentioned. Thank you for reading.
