
 Yahoo Finance
 Health Check: How Prudently Does SLM Solutions Group (ETR:AM3D) Use Debt?

Warren Buffett famously said, 'Volatility is far from synonymous with risk.' It's only natural to consider a company's balance sheet when you examine how risky it is, since debt is often involved when a business collapses. We can see that SLM Solutions Group AG (ETR:AM3D) does use debt in its business. But the real question is whether this debt is making the company risky.
When Is Debt Dangerous?
Debt assists a business until the business has trouble paying it off, either with new capital or with free cash flow. Ultimately, if the company can't fulfill its legal obligations to repay debt, shareholders could walk away with nothing. However, a more common (but still painful) scenario is that it has to raise new equity capital at a low price, thus permanently diluting shareholders. Of course, debt can be an important tool in businesses, particularly capital heavy businesses. The first step when considering a company's debt levels is to consider its cash and debt together.
View our latest analysis for SLM Solutions Group
What Is SLM Solutions Group's Debt?
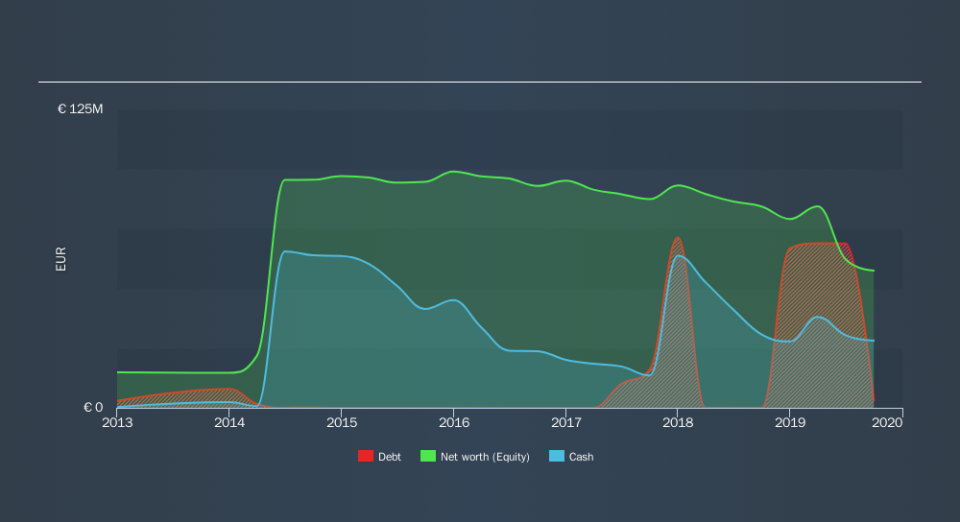
You can click the graphic below for the historical numbers, but it shows that as of September 2019 SLM Solutions Group had €3.16m of debt, an increase on none, over one year. However, it does have €28.1m in cash offsetting this, leading to net cash of €25.0m.
How Strong Is SLM Solutions Group's Balance Sheet?
We can see from the most recent balance sheet that SLM Solutions Group had liabilities of €20.2m falling due within a year, and liabilities of €72.5m due beyond that. On the other hand, it had cash of €28.1m and €19.3m worth of receivables due within a year. So its liabilities total €45.4m more than the combination of its cash and short-term receivables.
Of course, SLM Solutions Group has a market capitalization of €309.7m, so these liabilities are probably manageable. But there are sufficient liabilities that we would certainly recommend shareholders continue to monitor the balance sheet, going forward. Despite its noteworthy liabilities, SLM Solutions Group boasts net cash, so it's fair to say it does not have a heavy debt load! When analysing debt levels, the balance sheet is the obvious place to start. But ultimately the future profitability of the business will decide if SLM Solutions Group can strengthen its balance sheet over time. So if you want to see what the professionals think, you might find this free report on analyst profit forecasts to be interesting.
Over 12 months, SLM Solutions Group made a loss at the EBIT level, and saw its revenue drop to €61m, which is a fall of 28%. To be frank that doesn't bode well.
So How Risky Is SLM Solutions Group?
We have no doubt that loss making companies are, in general, riskier than profitable ones. And the fact is that over the last twelve months SLM Solutions Group lost money at the earnings before interest and tax (EBIT) line. And over the same period it saw negative free cash outflow of €11m and booked a €40m accounting loss. However, it has net cash of €25.0m, so it has a bit of time before it will need more capital. Overall, we'd say the stock is a bit risky, and we're usually very cautious until we see positive free cash flow. When we look at a riskier company, we like to check how their profits (or losses) are trending over time. Today, we're providing readers this interactive graph showing how SLM Solutions Group's profit, revenue, and operating cashflow have changed over the last few years.
At the end of the day, it's often better to focus on companies that are free from net debt. You can access our special list of such companies (all with a track record of profit growth). It's free.
We aim to bring you long-term focused research analysis driven by fundamental data. Note that our analysis may not factor in the latest price-sensitive company announcements or qualitative material.
If you spot an error that warrants correction, please contact the editor at editorial-team@simplywallst.com. This article by Simply Wall St is general in nature. It does not constitute a recommendation to buy or sell any stock, and does not take account of your objectives, or your financial situation. Simply Wall St has no position in the stocks mentioned. Thank you for reading.
