
 Yahoo Finance
 Here’s What’s Happening With Returns At Big Rock Brewery (TSE:BR)

What are the early trends we should look for to identify a stock that could multiply in value over the long term? One common approach is to try and find a company with returns on capital employed (ROCE) that are increasing, in conjunction with a growing amount of capital employed. Put simply, these types of businesses are compounding machines, meaning they are continually reinvesting their earnings at ever-higher rates of return. Speaking of which, we noticed some great changes in Big Rock Brewery's (TSE:BR) returns on capital, so let's have a look.
Understanding Return On Capital Employed (ROCE)
If you haven't worked with ROCE before, it measures the 'return' (pre-tax profit) a company generates from capital employed in its business. The formula for this calculation on Big Rock Brewery is:
Return on Capital Employed = Earnings Before Interest and Tax (EBIT) ÷ (Total Assets - Current Liabilities)
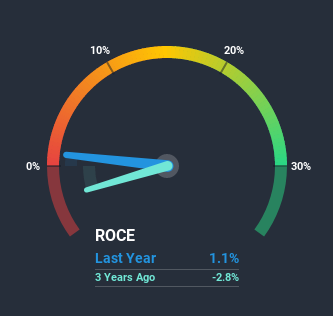
0.011 = CA$506k ÷ (CA$56m - CA$8.1m) (Based on the trailing twelve months to September 2020).
Thus, Big Rock Brewery has an ROCE of 1.1%. In absolute terms, that's a low return and it also under-performs the Beverage industry average of 13%.
View our latest analysis for Big Rock Brewery
While the past is not representative of the future, it can be helpful to know how a company has performed historically, which is why we have this chart above. If you want to delve into the historical earnings, revenue and cash flow of Big Rock Brewery, check out these free graphs here.
What Does the ROCE Trend For Big Rock Brewery Tell Us?
Big Rock Brewery has broken into the black (profitability) and we're sure it's a sight for sore eyes. The company now earns 1.1% on its capital, because five years ago it was incurring losses. Interestingly, the capital employed by the business has remained relatively flat, so these higher returns are either from prior investments paying off or increased efficiencies. So while we're happy that the business is more efficient, just keep in mind that could mean that going forward the business is lacking areas to invest internally for growth. Because in the end, a business can only get so efficient.
What We Can Learn From Big Rock Brewery's ROCE
In summary, we're delighted to see that Big Rock Brewery has been able to increase efficiencies and earn higher rates of return on the same amount of capital. And since the stock has fallen 15% over the last five years, there might be an opportunity here. With that in mind, we believe the promising trends warrant this stock for further investigation.
Since virtually every company faces some risks, it's worth knowing what they are, and we've spotted 2 warning signs for Big Rock Brewery (of which 1 is concerning!) that you should know about.
While Big Rock Brewery isn't earning the highest return, check out this free list of companies that are earning high returns on equity with solid balance sheets.
This article by Simply Wall St is general in nature. It does not constitute a recommendation to buy or sell any stock, and does not take account of your objectives, or your financial situation. We aim to bring you long-term focused analysis driven by fundamental data. Note that our analysis may not factor in the latest price-sensitive company announcements or qualitative material. Simply Wall St has no position in any stocks mentioned.
Have feedback on this article? Concerned about the content? Get in touch with us directly. Alternatively, email editorial-team@simplywallst.com.
