
 Yahoo Finance
 If You Had Bought Vermilion Energy (TSE:VET) Stock A Year Ago, You Could Pocket A 140% Gain Today
The most you can lose on any stock (assuming you don't use leverage) is 100% of your money. But when you pick a company that is really flourishing, you can make more than 100%. Take, for example Vermilion Energy Inc. (TSE:VET). Its share price is already up an impressive 140% in the last twelve months. On top of that, the share price is up 62% in about a quarter. This could be related to the recent financial results, released recently - you can catch up on the most recent data by reading our company report. Unfortunately the longer term returns are not so good, with the stock falling 74% in the last three years.
See our latest analysis for Vermilion Energy
Because Vermilion Energy made a loss in the last twelve months, we think the market is probably more focussed on revenue and revenue growth, at least for now. Generally speaking, companies without profits are expected to grow revenue every year, and at a good clip. Some companies are willing to postpone profitability to grow revenue faster, but in that case one does expect good top-line growth.
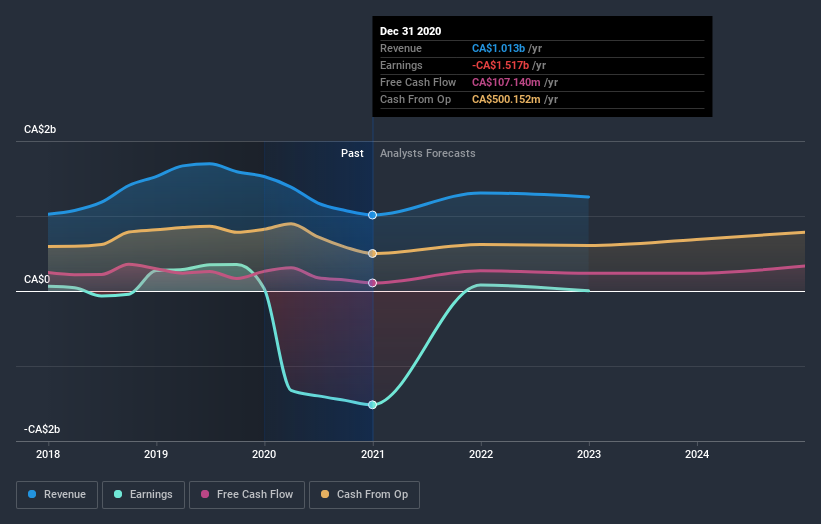
In the last year Vermilion Energy saw its revenue shrink by 34%. We're a little surprised to see the share price pop 140% in the last year. This is a good example of how buyers can push up prices even before the fundamental metrics show much growth. Of course, it could be that the market expected this revenue drop.
The image below shows how earnings and revenue have tracked over time (if you click on the image you can see greater detail).
Take a more thorough look at Vermilion Energy's financial health with this free report on its balance sheet.
What about the Total Shareholder Return (TSR)?
Investors should note that there's a difference between Vermilion Energy's total shareholder return (TSR) and its share price change, which we've covered above. The TSR is a return calculation that accounts for the value of cash dividends (assuming that any dividend received was reinvested) and the calculated value of any discounted capital raisings and spin-offs. Dividends have been really beneficial for Vermilion Energy shareholders, and that cash payout contributed to why its TSR of 148%, over the last year, is better than the share price return.
A Different Perspective
It's nice to see that Vermilion Energy shareholders have received a total shareholder return of 148% over the last year. That certainly beats the loss of about 11% per year over the last half decade. This makes us a little wary, but the business might have turned around its fortunes. It's always interesting to track share price performance over the longer term. But to understand Vermilion Energy better, we need to consider many other factors. For example, we've discovered 1 warning sign for Vermilion Energy that you should be aware of before investing here.
Of course Vermilion Energy may not be the best stock to buy. So you may wish to see this free collection of growth stocks.
Please note, the market returns quoted in this article reflect the market weighted average returns of stocks that currently trade on CA exchanges.
This article by Simply Wall St is general in nature. It does not constitute a recommendation to buy or sell any stock, and does not take account of your objectives, or your financial situation. We aim to bring you long-term focused analysis driven by fundamental data. Note that our analysis may not factor in the latest price-sensitive company announcements or qualitative material. Simply Wall St has no position in any stocks mentioned.
Have feedback on this article? Concerned about the content? Get in touch with us directly. Alternatively, email editorial-team (at) simplywallst.com.