
 Yahoo Finance
 If You Had Bought Schneider Electric (EPA:SU) Stock Three Years Ago, You Could Pocket A 40% Gain Today

Want to participate in a short research study? Help shape the future of investing tools and you could win a $250 gift card!
Vanguard founder Jack Bogle helped spearhead the low-cost index fund, putting average returns within reach of every investor. But you can make superior returns by picking better-than average stocks. Notably, the Schneider Electric S.E. (EPA:SU) share price has gained 40% in three years, which is better than the average market return. Zooming in, the stock is up a respectable 11% in the last year.
View our latest analysis for Schneider Electric
To paraphrase Benjamin Graham: Over the short term the market is a voting machine, but over the long term it's a weighing machine. One flawed but reasonable way to assess how sentiment around a company has changed is to compare the earnings per share (EPS) with the share price.
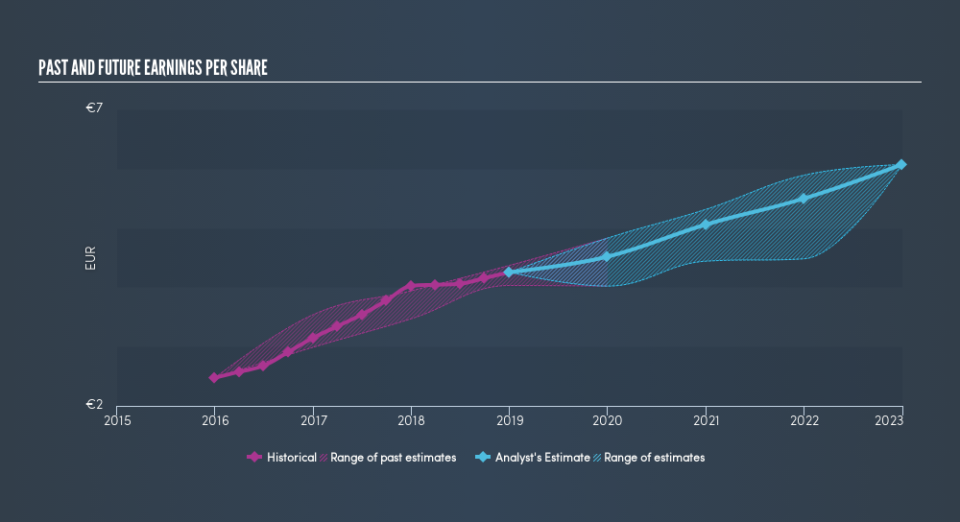
During three years of share price growth, Schneider Electric achieved compound earnings per share growth of 20% per year. This EPS growth is higher than the 12% average annual increase in the share price. So it seems investors have become more cautious about the company, over time.
You can see below how EPS has changed over time (discover the exact values by clicking on the image).
This free interactive report on Schneider Electric's earnings, revenue and cash flow is a great place to start, if you want to investigate the stock further.
What About Dividends?
It is important to consider the total shareholder return, as well as the share price return, for any given stock. Whereas the share price return only reflects the change in the share price, the TSR includes the value of dividends (assuming they were reinvested) and the benefit of any discounted capital raising or spin-off. It's fair to say that the TSR gives a more complete picture for stocks that pay a dividend. As it happens, Schneider Electric's TSR for the last 3 years was 53%, which exceeds the share price return mentioned earlier. And there's no prize for guessing that the dividend payments largely explain the divergence!
A Different Perspective
It's good to see that Schneider Electric has rewarded shareholders with a total shareholder return of 15% in the last twelve months. And that does include the dividend. That's better than the annualised return of 6.0% over half a decade, implying that the company is doing better recently. Given the share price momentum remains strong, it might be worth taking a closer look at the stock, lest you miss an opportunity. Importantly, we haven't analysed Schneider Electric's dividend history. This free visual report on its dividends is a must-read if you're thinking of buying.
But note: Schneider Electric may not be the best stock to buy. So take a peek at this free list of interesting companies with past earnings growth (and further growth forecast).
Please note, the market returns quoted in this article reflect the market weighted average returns of stocks that currently trade on FR exchanges.
We aim to bring you long-term focused research analysis driven by fundamental data. Note that our analysis may not factor in the latest price-sensitive company announcements or qualitative material.
If you spot an error that warrants correction, please contact the editor at editorial-team@simplywallst.com. This article by Simply Wall St is general in nature. It does not constitute a recommendation to buy or sell any stock, and does not take account of your objectives, or your financial situation. Simply Wall St has no position in the stocks mentioned. Thank you for reading.
