
 Yahoo Finance
 If You Had Bought Luminex (NASDAQ:LMNX) Stock A Year Ago, You'd Be Sitting On A 39% Loss, Today
It's easy to match the overall market return by buying an index fund. But if you buy individual stocks, you can do both better or worse than that. Unfortunately the Luminex Corporation (NASDAQ:LMNX) share price slid 39% over twelve months. That falls noticeably short of the market return of around 6.2%. Longer term shareholders haven't suffered as badly, since the stock is down a comparatively less painful 8.7% in three years. It's up 2.3% in the last seven days.
Check out our latest analysis for Luminex
In his essay The Superinvestors of Graham-and-Doddsville Warren Buffett described how share prices do not always rationally reflect the value of a business. One imperfect but simple way to consider how the market perception of a company has shifted is to compare the change in the earnings per share (EPS) with the share price movement.
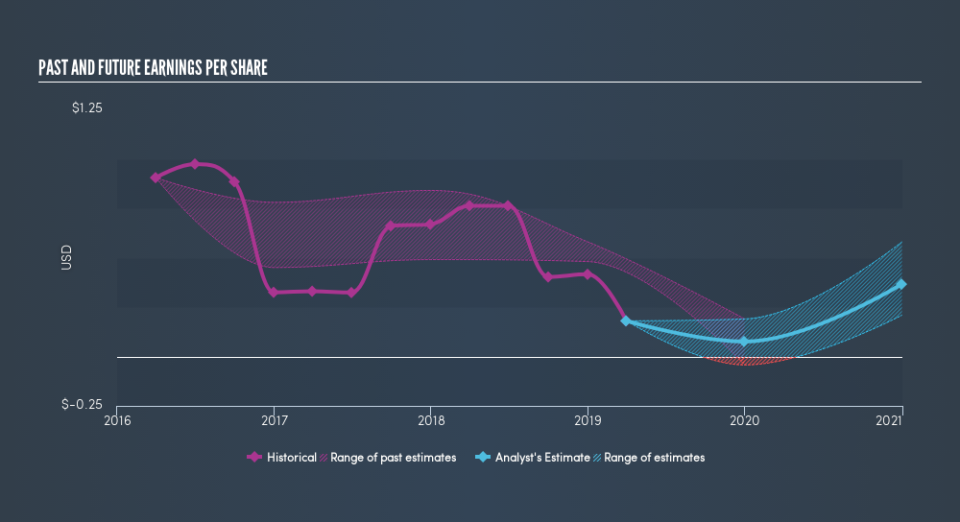
Unhappily, Luminex had to report a 76% decline in EPS over the last year. This fall in the EPS is significantly worse than the 39% the share price fall. It may have been that the weak EPS was not as bad as some had feared. Indeed, with a P/E ratio of 114.34 there is obviously some real optimism that earnings will bounce back.
You can see how EPS has changed over time in the image below (click on the chart to see the exact values).
This free interactive report on Luminex's earnings, revenue and cash flow is a great place to start, if you want to investigate the stock further.
What about the Total Shareholder Return (TSR)?
Investors should note that there's a difference between Luminex's total shareholder return (TSR) and its share price change, which we've covered above. Arguably the TSR is a more complete return calculation because it accounts for the value of dividends (as if they were reinvested), along with the hypothetical value of any discounted capital that have been offered to shareholders. Dividends have been really beneficial for Luminex shareholders, and that cash payout explains why its total shareholder loss of 38%, over the last year, isn't as bad as the share price return.
A Different Perspective
Luminex shareholders are down 38% for the year (even including dividends), but the market itself is up 6.2%. However, keep in mind that even the best stocks will sometimes underperform the market over a twelve month period. On the bright side, long term shareholders have made money, with a gain of 3.1% per year over half a decade. It could be that the recent sell-off is an opportunity, so it may be worth checking the fundamental data for signs of a long term growth trend. You could get a better understanding of Luminex's growth by checking out this more detailed historical graph of earnings, revenue and cash flow.
If you are like me, then you will not want to miss this free list of growing companies that insiders are buying.
Please note, the market returns quoted in this article reflect the market weighted average returns of stocks that currently trade on US exchanges.
We aim to bring you long-term focused research analysis driven by fundamental data. Note that our analysis may not factor in the latest price-sensitive company announcements or qualitative material.
If you spot an error that warrants correction, please contact the editor at editorial-team@simplywallst.com. This article by Simply Wall St is general in nature. It does not constitute a recommendation to buy or sell any stock, and does not take account of your objectives, or your financial situation. Simply Wall St has no position in the stocks mentioned. Thank you for reading.
