
 Yahoo Finance
 If You Had Bought Gold Road Resources (ASX:GOR) Shares Five Years Ago You'd Have Earned 231% Returns
It hasn't been the best quarter for Gold Road Resources Limited (ASX:GOR) shareholders, since the share price has fallen 20% in that time. But that scarcely detracts from the really solid long term returns generated by the company over five years. In fact, the share price is 231% higher today. We think it's more important to dwell on the long term returns than the short term returns. Of course, that doesn't necessarily mean it's cheap now.
Check out our latest analysis for Gold Road Resources
While markets are a powerful pricing mechanism, share prices reflect investor sentiment, not just underlying business performance. One imperfect but simple way to consider how the market perception of a company has shifted is to compare the change in the earnings per share (EPS) with the share price movement.
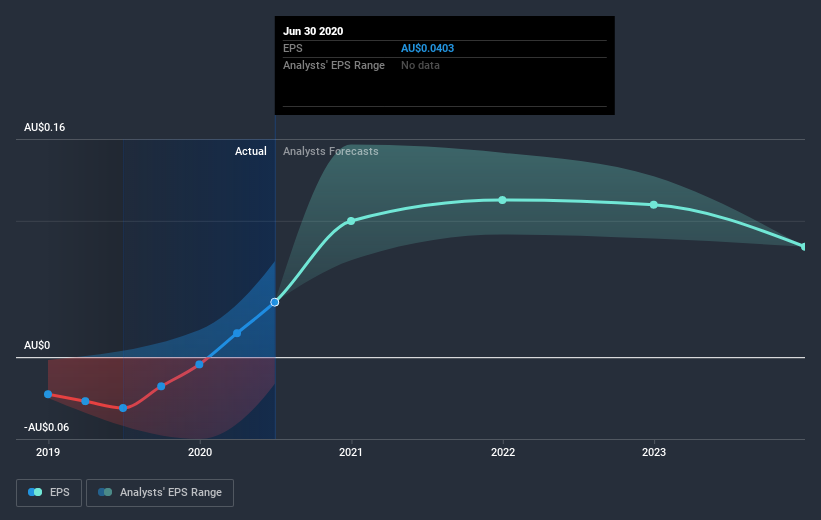
During the five years of share price growth, Gold Road Resources moved from a loss to profitability. That kind of transition can be an inflection point that justifies a strong share price gain, just as we have seen here.
The graphic below depicts how EPS has changed over time (unveil the exact values by clicking on the image).
We like that insiders have been buying shares in the last twelve months. Having said that, most people consider earnings and revenue growth trends to be a more meaningful guide to the business. Dive deeper into the earnings by checking this interactive graph of Gold Road Resources' earnings, revenue and cash flow.
What about the Total Shareholder Return (TSR)?
We'd be remiss not to mention the difference between Gold Road Resources' total shareholder return (TSR) and its share price return. Arguably the TSR is a more complete return calculation because it accounts for the value of dividends (as if they were reinvested), along with the hypothetical value of any discounted capital that have been offered to shareholders. We note that Gold Road Resources' TSR, at 235% is higher than its share price return of 231%. When you consider it hasn't been paying a dividend, this data suggests shareholders have benefitted from a spin-off, or had the opportunity to acquire attractively priced shares in a discounted capital raising.
A Different Perspective
It's good to see that Gold Road Resources has rewarded shareholders with a total shareholder return of 23% in the last twelve months. However, the TSR over five years, coming in at 27% per year, is even more impressive. I find it very interesting to look at share price over the long term as a proxy for business performance. But to truly gain insight, we need to consider other information, too. For instance, we've identified 1 warning sign for Gold Road Resources that you should be aware of.
If you like to buy stocks alongside management, then you might just love this free list of companies. (Hint: insiders have been buying them).
Please note, the market returns quoted in this article reflect the market weighted average returns of stocks that currently trade on AU exchanges.
This article by Simply Wall St is general in nature. It does not constitute a recommendation to buy or sell any stock, and does not take account of your objectives, or your financial situation. We aim to bring you long-term focused analysis driven by fundamental data. Note that our analysis may not factor in the latest price-sensitive company announcements or qualitative material. Simply Wall St has no position in any stocks mentioned.
Have feedback on this article? Concerned about the content? Get in touch with us directly. Alternatively, email editorial-team@simplywallst.com.
