
 Yahoo Finance
 If You Had Bought Gear4music (Holdings) (LON:G4M) Shares Five Years Ago You'd Have Earned 459% Returns
We think all investors should try to buy and hold high quality multi-year winners. While the best companies are hard to find, but they can generate massive returns over long periods. To wit, the Gear4music (Holdings) plc (LON:G4M) share price has soared 459% over five years. If that doesn't get you thinking about long term investing, we don't know what will. On the other hand, we note it's down 8.5% in about a month.
See our latest analysis for Gear4music (Holdings)
To paraphrase Benjamin Graham: Over the short term the market is a voting machine, but over the long term it's a weighing machine. One flawed but reasonable way to assess how sentiment around a company has changed is to compare the earnings per share (EPS) with the share price.
During the last half decade, Gear4music (Holdings) became profitable. That kind of transition can be an inflection point that justifies a strong share price gain, just as we have seen here. Given that the company made a profit three years ago, but not five years ago, it is worth looking at the share price returns over the last three years, too. We can see that the Gear4music (Holdings) share price is up 16% in the last three years. In the same period, EPS is up 68% per year. This EPS growth is higher than the 5% average annual increase in the share price over the same three years. Therefore, it seems the market has moderated its expectations for growth, somewhat.
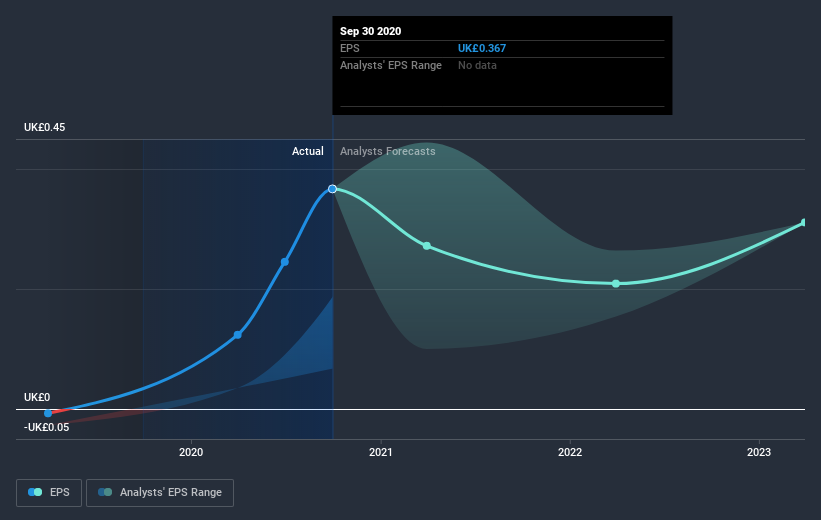
You can see below how EPS has changed over time (discover the exact values by clicking on the image).
We're pleased to report that the CEO is remunerated more modestly than most CEOs at similarly capitalized companies. But while CEO remuneration is always worth checking, the really important question is whether the company can grow earnings going forward. It might be well worthwhile taking a look at our free report on Gear4music (Holdings)'s earnings, revenue and cash flow.
A Different Perspective
We're pleased to report that Gear4music (Holdings) shareholders have received a total shareholder return of 188% over one year. Since the one-year TSR is better than the five-year TSR (the latter coming in at 41% per year), it would seem that the stock's performance has improved in recent times. Someone with an optimistic perspective could view the recent improvement in TSR as indicating that the business itself is getting better with time. I find it very interesting to look at share price over the long term as a proxy for business performance. But to truly gain insight, we need to consider other information, too. To that end, you should learn about the 3 warning signs we've spotted with Gear4music (Holdings) (including 1 which can't be ignored) .
Of course Gear4music (Holdings) may not be the best stock to buy. So you may wish to see this free collection of growth stocks.
Please note, the market returns quoted in this article reflect the market weighted average returns of stocks that currently trade on GB exchanges.
This article by Simply Wall St is general in nature. It does not constitute a recommendation to buy or sell any stock, and does not take account of your objectives, or your financial situation. We aim to bring you long-term focused analysis driven by fundamental data. Note that our analysis may not factor in the latest price-sensitive company announcements or qualitative material. Simply Wall St has no position in any stocks mentioned.
Have feedback on this article? Concerned about the content? Get in touch with us directly. Alternatively, email editorial-team (at) simplywallst.com.
