
 Yahoo Finance
 If You Had Bought Experian (LON:EXPN) Shares Five Years Ago You'd Have Made 140%

Want to participate in a short research study? Help shape the future of investing tools and you could win a $250 gift card!
When you buy shares in a company, it's worth keeping in mind the possibility that it could fail, and you could lose your money. But when you pick a company that is really flourishing, you can make more than 100%. For instance, the price of Experian plc (LON:EXPN) stock is up an impressive 140% over the last five years. Also pleasing for shareholders was the 18% gain in the last three months. This could be related to the recent financial results, released recently - you can catch up on the most recent data by reading our company report.
Check out our latest analysis for Experian
While the efficient markets hypothesis continues to be taught by some, it has been proven that markets are over-reactive dynamic systems, and investors are not always rational. One flawed but reasonable way to assess how sentiment around a company has changed is to compare the earnings per share (EPS) with the share price.
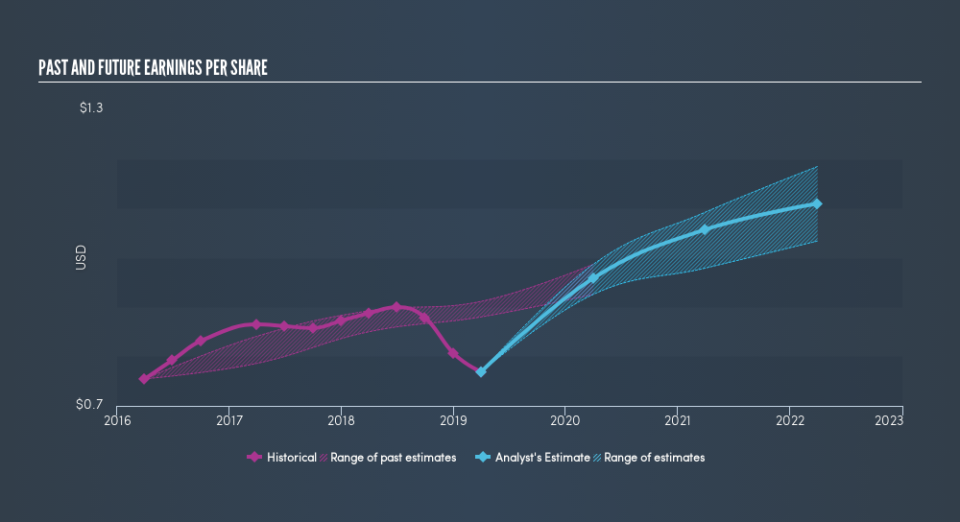
During five years of share price growth, Experian achieved compound earnings per share (EPS) growth of 0.2% per year. This EPS growth is lower than the 19% average annual increase in the share price. So it's fair to assume the market has a higher opinion of the business than it did five years ago. And that's hardly shocking given the track record of growth.
You can see below how EPS has changed over time (discover the exact values by clicking on the image).
Before buying or selling a stock, we always recommend a close examination of historic growth trends, available here..
What About Dividends?
When looking at investment returns, it is important to consider the difference between total shareholder return (TSR) and share price return. The TSR is a return calculation that accounts for the value of cash dividends (assuming that any dividend received was reinvested) and the calculated value of any discounted capital raisings and spin-offs. So for companies that pay a generous dividend, the TSR is often a lot higher than the share price return. We note that for Experian the TSR over the last 5 years was 166%, which is better than the share price return mentioned above. The dividends paid by the company have thusly boosted the total shareholder return.
A Different Perspective
It's good to see that Experian has rewarded shareholders with a total shareholder return of 31% in the last twelve months. That's including the dividend. Since the one-year TSR is better than the five-year TSR (the latter coming in at 22% per year), it would seem that the stock's performance has improved in recent times. Someone with an optimistic perspective could view the recent improvement in TSR as indicating that the business itself is getting better with time. Before spending more time on Experian it might be wise to click here to see if insiders have been buying or selling shares.
But note: Experian may not be the best stock to buy. So take a peek at this free list of interesting companies with past earnings growth (and further growth forecast).
Please note, the market returns quoted in this article reflect the market weighted average returns of stocks that currently trade on GB exchanges.
We aim to bring you long-term focused research analysis driven by fundamental data. Note that our analysis may not factor in the latest price-sensitive company announcements or qualitative material.
If you spot an error that warrants correction, please contact the editor at editorial-team@simplywallst.com. This article by Simply Wall St is general in nature. It does not constitute a recommendation to buy or sell any stock, and does not take account of your objectives, or your financial situation. Simply Wall St has no position in the stocks mentioned. Thank you for reading.
