
 Yahoo Finance
 If You Had Bought Cummins (NYSE:CMI) Stock Five Years Ago, You Could Pocket A 18% Gain Today

Cummins Inc. (NYSE:CMI) shareholders might be concerned after seeing the share price drop 11% in the last quarter. On the bright side the share price is up over the last half decade. However we are not very impressed because the share price is only up 18%, less than the market return of 69%.
Check out our latest analysis for Cummins
There is no denying that markets are sometimes efficient, but prices do not always reflect underlying business performance. One way to examine how market sentiment has changed over time is to look at the interaction between a company's share price and its earnings per share (EPS).
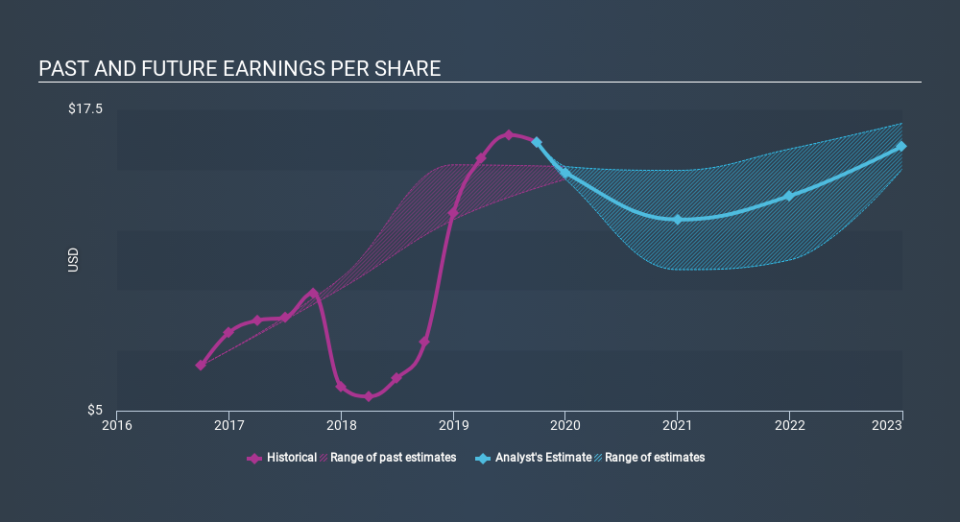
During five years of share price growth, Cummins achieved compound earnings per share (EPS) growth of 13% per year. This EPS growth is higher than the 3.3% average annual increase in the share price. So one could conclude that the broader market has become more cautious towards the stock. The reasonably low P/E ratio of 9.91 also suggests market apprehension.
You can see how EPS has changed over time in the image below (click on the chart to see the exact values).
It is of course excellent to see how Cummins has grown profits over the years, but the future is more important for shareholders. Take a more thorough look at Cummins's financial health with this free report on its balance sheet.
What About Dividends?
It is important to consider the total shareholder return, as well as the share price return, for any given stock. Whereas the share price return only reflects the change in the share price, the TSR includes the value of dividends (assuming they were reinvested) and the benefit of any discounted capital raising or spin-off. It's fair to say that the TSR gives a more complete picture for stocks that pay a dividend. In the case of Cummins, it has a TSR of 37% for the last 5 years. That exceeds its share price return that we previously mentioned. And there's no prize for guessing that the dividend payments largely explain the divergence!
A Different Perspective
Cummins shareholders gained a total return of 12% during the year. But that return falls short of the market. The silver lining is that the gain was actually better than the average annual return of 6.5% per year over five year. This suggests the company might be improving over time. It's always interesting to track share price performance over the longer term. But to understand Cummins better, we need to consider many other factors. Take risks, for example - Cummins has 1 warning sign we think you should be aware of.
Of course Cummins may not be the best stock to buy. So you may wish to see this free collection of growth stocks.
Please note, the market returns quoted in this article reflect the market weighted average returns of stocks that currently trade on US exchanges.
If you spot an error that warrants correction, please contact the editor at editorial-team@simplywallst.com. This article by Simply Wall St is general in nature. It does not constitute a recommendation to buy or sell any stock, and does not take account of your objectives, or your financial situation. Simply Wall St has no position in the stocks mentioned.
We aim to bring you long-term focused research analysis driven by fundamental data. Note that our analysis may not factor in the latest price-sensitive company announcements or qualitative material. Thank you for reading.
