
 Yahoo Finance
 If You Had Bought Consolidated Edison's (NYSE:ED) Shares A Year Ago You Would Be Down 13%
Consolidated Edison, Inc. (NYSE:ED) shareholders should be happy to see the share price up 12% in the last quarter. But that doesn't change the reality of under-performance over the last twelve months. In fact the stock is down 13% in the last year, well below the market return.
See our latest analysis for Consolidated Edison
In his essay The Superinvestors of Graham-and-Doddsville Warren Buffett described how share prices do not always rationally reflect the value of a business. By comparing earnings per share (EPS) and share price changes over time, we can get a feel for how investor attitudes to a company have morphed over time.
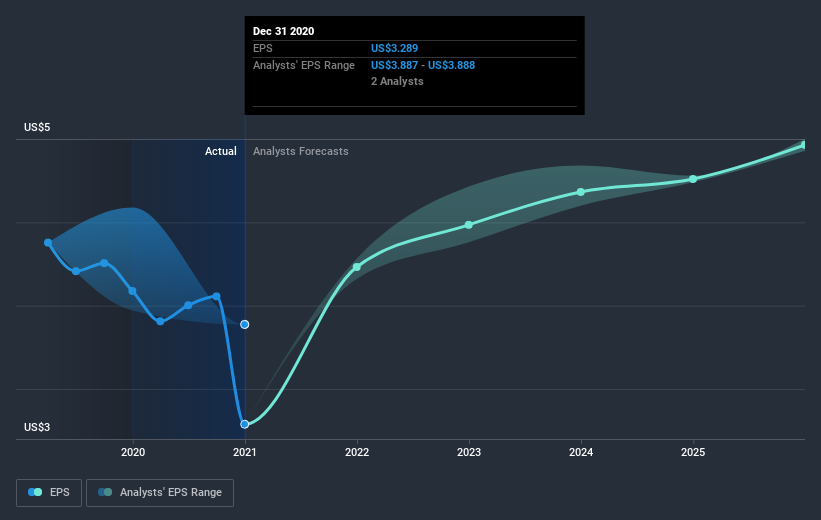
Unhappily, Consolidated Edison had to report a 20% decline in EPS over the last year. This fall in the EPS is significantly worse than the 13% the share price fall. So the market may not be too worried about the EPS figure, at the moment -- or it may have expected earnings to drop faster.
The company's earnings per share (over time) is depicted in the image below (click to see the exact numbers).
It's good to see that there was some significant insider buying in the last three months. That's a positive. On the other hand, we think the revenue and earnings trends are much more meaningful measures of the business. Before buying or selling a stock, we always recommend a close examination of historic growth trends, available here..
What About Dividends?
When looking at investment returns, it is important to consider the difference between total shareholder return (TSR) and share price return. The TSR incorporates the value of any spin-offs or discounted capital raisings, along with any dividends, based on the assumption that the dividends are reinvested. It's fair to say that the TSR gives a more complete picture for stocks that pay a dividend. We note that for Consolidated Edison the TSR over the last year was -9.0%, which is better than the share price return mentioned above. This is largely a result of its dividend payments!
A Different Perspective
While the broader market gained around 57% in the last year, Consolidated Edison shareholders lost 9.0% (even including dividends). However, keep in mind that even the best stocks will sometimes underperform the market over a twelve month period. On the bright side, long term shareholders have made money, with a gain of 6% per year over half a decade. It could be that the recent sell-off is an opportunity, so it may be worth checking the fundamental data for signs of a long term growth trend. It's always interesting to track share price performance over the longer term. But to understand Consolidated Edison better, we need to consider many other factors. To that end, you should learn about the 3 warning signs we've spotted with Consolidated Edison (including 1 which is significant) .
Consolidated Edison is not the only stock that insiders are buying. For those who like to find winning investments this free list of growing companies with recent insider purchasing, could be just the ticket.
Please note, the market returns quoted in this article reflect the market weighted average returns of stocks that currently trade on US exchanges.
This article by Simply Wall St is general in nature. It does not constitute a recommendation to buy or sell any stock, and does not take account of your objectives, or your financial situation. We aim to bring you long-term focused analysis driven by fundamental data. Note that our analysis may not factor in the latest price-sensitive company announcements or qualitative material. Simply Wall St has no position in any stocks mentioned.
Have feedback on this article? Concerned about the content? Get in touch with us directly. Alternatively, email editorial-team (at) simplywallst.com.
