
 Yahoo Finance
 If You Had Bought Canacol Energy's (TSE:CNE) Shares Three Years Ago You Would Be Down 20%
As an investor its worth striving to ensure your overall portfolio beats the market average. But its virtually certain that sometimes you will buy stocks that fall short of the market average returns. We regret to report that long term Canacol Energy Ltd (TSE:CNE) shareholders have had that experience, with the share price dropping 20% in three years, versus a market return of about 29%. There was little comfort for shareholders in the last week as the price declined a further 1.7%.
View our latest analysis for Canacol Energy
Because Canacol Energy made a loss in the last twelve months, we think the market is probably more focussed on revenue and revenue growth, at least for now. When a company doesn't make profits, we'd generally expect to see good revenue growth. As you can imagine, fast revenue growth, when maintained, often leads to fast profit growth.
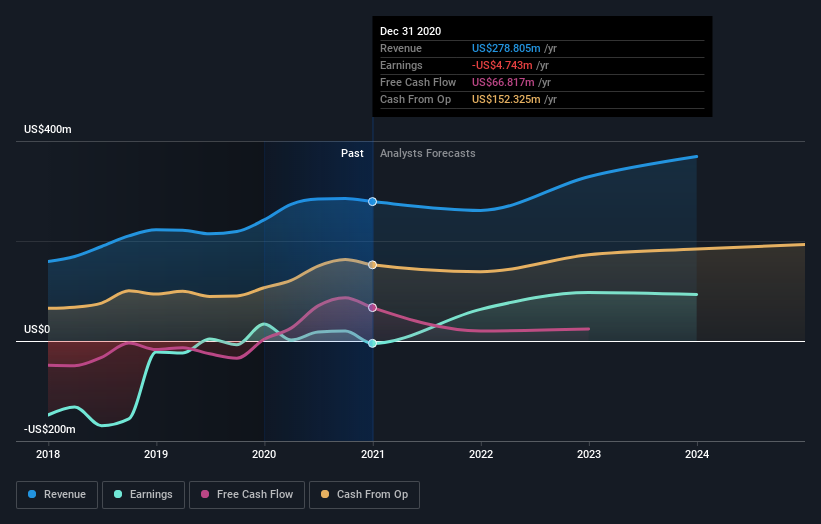
Over three years, Canacol Energy grew revenue at 18% per year. That's a fairly respectable growth rate. Shareholders have endured a share price decline of 6% per year. This implies the market had higher expectations of Canacol Energy. However, that's in the past now, and it's the future is more important - and the future looks brighter (based on revenue, anyway).
You can see how earnings and revenue have changed over time in the image below (click on the chart to see the exact values).
Take a more thorough look at Canacol Energy's financial health with this free report on its balance sheet.
What About Dividends?
When looking at investment returns, it is important to consider the difference between total shareholder return (TSR) and share price return. The TSR is a return calculation that accounts for the value of cash dividends (assuming that any dividend received was reinvested) and the calculated value of any discounted capital raisings and spin-offs. It's fair to say that the TSR gives a more complete picture for stocks that pay a dividend. As it happens, Canacol Energy's TSR for the last 3 years was -13%, which exceeds the share price return mentioned earlier. And there's no prize for guessing that the dividend payments largely explain the divergence!
A Different Perspective
Canacol Energy shareholders gained a total return of 0.9% during the year. But that was short of the market average. But at least that's still a gain! Over five years the TSR has been a reduction of 0.2% per year, over five years. It could well be that the business is stabilizing. It's always interesting to track share price performance over the longer term. But to understand Canacol Energy better, we need to consider many other factors. Even so, be aware that Canacol Energy is showing 1 warning sign in our investment analysis , you should know about...
Of course, you might find a fantastic investment by looking elsewhere. So take a peek at this free list of companies we expect will grow earnings.
Please note, the market returns quoted in this article reflect the market weighted average returns of stocks that currently trade on CA exchanges.
This article by Simply Wall St is general in nature. It does not constitute a recommendation to buy or sell any stock, and does not take account of your objectives, or your financial situation. We aim to bring you long-term focused analysis driven by fundamental data. Note that our analysis may not factor in the latest price-sensitive company announcements or qualitative material. Simply Wall St has no position in any stocks mentioned.
Have feedback on this article? Concerned about the content? Get in touch with us directly. Alternatively, email editorial-team (at) simplywallst.com.
