
 Yahoo Finance
 If You Had Bought Broadridge Financial Solutions (NYSE:BR) Stock Five Years Ago, You Could Pocket A 182% Gain Today

The most you can lose on any stock (assuming you don't use leverage) is 100% of your money. But when you pick a company that is really flourishing, you can make more than 100%. One great example is Broadridge Financial Solutions, Inc. (NYSE:BR) which saw its share price drive 182% higher over five years. Meanwhile the share price is 1.4% higher than it was a week ago.
See our latest analysis for Broadridge Financial Solutions
While the efficient markets hypothesis continues to be taught by some, it has been proven that markets are over-reactive dynamic systems, and investors are not always rational. One way to examine how market sentiment has changed over time is to look at the interaction between a company's share price and its earnings per share (EPS).
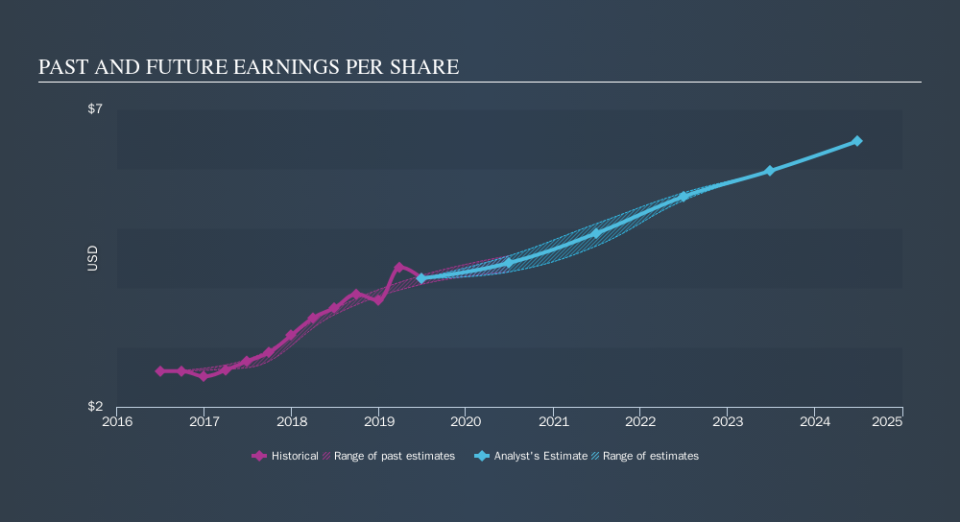
Over half a decade, Broadridge Financial Solutions managed to grow its earnings per share at 14% a year. This EPS growth is slower than the share price growth of 23% per year, over the same period. So it's fair to assume the market has a higher opinion of the business than it did five years ago. And that's hardly shocking given the track record of growth.
You can see how EPS has changed over time in the image below (click on the chart to see the exact values).
We know that Broadridge Financial Solutions has improved its bottom line lately, but is it going to grow revenue? You could check out this free report showing analyst revenue forecasts.
What About Dividends?
When looking at investment returns, it is important to consider the difference between total shareholder return (TSR) and share price return. The TSR incorporates the value of any spin-offs or discounted capital raisings, along with any dividends, based on the assumption that the dividends are reinvested. So for companies that pay a generous dividend, the TSR is often a lot higher than the share price return. In the case of Broadridge Financial Solutions, it has a TSR of 209% for the last 5 years. That exceeds its share price return that we previously mentioned. The dividends paid by the company have thusly boosted the total shareholder return.
A Different Perspective
Broadridge Financial Solutions shareholders gained a total return of 9.6% during the year. Unfortunately this falls short of the market return. On the bright side, the longer term returns (running at about 25% a year, over half a decade) look better. It's quite possible the business continues to execute with prowess, even as the share price gains are slowing. Before spending more time on Broadridge Financial Solutions it might be wise to click here to see if insiders have been buying or selling shares.
If you would prefer to check out another company -- one with potentially superior financials -- then do not miss this free list of companies that have proven they can grow earnings.
Please note, the market returns quoted in this article reflect the market weighted average returns of stocks that currently trade on US exchanges.
We aim to bring you long-term focused research analysis driven by fundamental data. Note that our analysis may not factor in the latest price-sensitive company announcements or qualitative material.
If you spot an error that warrants correction, please contact the editor at editorial-team@simplywallst.com. This article by Simply Wall St is general in nature. It does not constitute a recommendation to buy or sell any stock, and does not take account of your objectives, or your financial situation. Simply Wall St has no position in the stocks mentioned. Thank you for reading.
