
 Yahoo Finance
 If You Had Bought BJ's Restaurants (NASDAQ:BJRI) Stock A Year Ago, You'd Be Sitting On A 50% Loss, Today

It's easy to match the overall market return by buying an index fund. While individual stocks can be big winners, plenty more fail to generate satisfactory returns. Investors in BJ's Restaurants, Inc. (NASDAQ:BJRI) have tasted that bitter downside in the last year, as the share price dropped 50%. That's well bellow the market return of 2.2%. On the bright side, the stock is actually up 1.3% in the last three years. The falls have accelerated recently, with the share price down 16% in the last three months.
See our latest analysis for BJ's Restaurants
While markets are a powerful pricing mechanism, share prices reflect investor sentiment, not just underlying business performance. One imperfect but simple way to consider how the market perception of a company has shifted is to compare the change in the earnings per share (EPS) with the share price movement.
Unhappily, BJ's Restaurants had to report a 20% decline in EPS over the last year. This reduction in EPS is not as bad as the 50% share price fall. So it seems the market was too confident about the business, a year ago.
You can see below how EPS has changed over time (discover the exact values by clicking on the image).
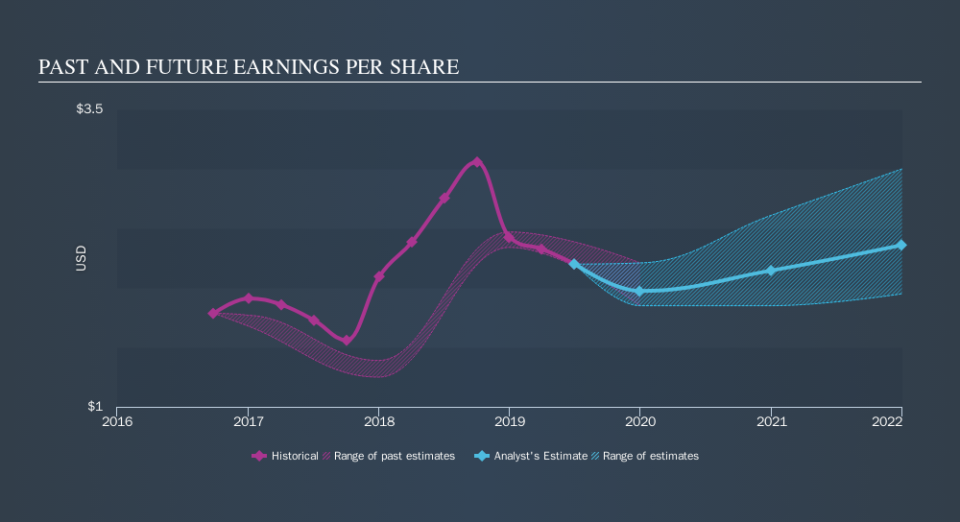
It's probably worth noting we've seen significant insider buying in the last quarter, which we consider a positive. That said, we think earnings and revenue growth trends are even more important factors to consider. Before buying or selling a stock, we always recommend a close examination of historic growth trends, available here..
What about the Total Shareholder Return (TSR)?
Investors should note that there's a difference between BJ's Restaurants's total shareholder return (TSR) and its share price change, which we've covered above. Arguably the TSR is a more complete return calculation because it accounts for the value of dividends (as if they were reinvested), along with the hypothetical value of any discounted capital that have been offered to shareholders. Dividends have been really beneficial for BJ's Restaurants shareholders, and that cash payout explains why its total shareholder loss of 49%, over the last year, isn't as bad as the share price return.
A Different Perspective
BJ's Restaurants shareholders are down 49% for the year (even including dividends) , but the market itself is up 2.2%. However, keep in mind that even the best stocks will sometimes underperform the market over a twelve month period. On the bright side, long term shareholders have made money, with a gain of 1.0% per year over half a decade. If the fundamental data continues to indicate long term sustainable growth, the current sell-off could be an opportunity worth considering. If you want to research this stock further, the data on insider buying is an obvious place to start. You can click here to see who has been buying shares - and the price they paid.
If you like to buy stocks alongside management, then you might just love this free list of companies. (Hint: insiders have been buying them).
Please note, the market returns quoted in this article reflect the market weighted average returns of stocks that currently trade on US exchanges.
We aim to bring you long-term focused research analysis driven by fundamental data. Note that our analysis may not factor in the latest price-sensitive company announcements or qualitative material.
If you spot an error that warrants correction, please contact the editor at editorial-team@simplywallst.com. This article by Simply Wall St is general in nature. It does not constitute a recommendation to buy or sell any stock, and does not take account of your objectives, or your financial situation. Simply Wall St has no position in the stocks mentioned. Thank you for reading.
