
 Yahoo Finance
 Is H&R Block, Inc.'s (NYSE:HRB) P/E Ratio Really That Good?

Want to participate in a short research study? Help shape the future of investing tools and you could win a $250 gift card!
The goal of this article is to teach you how to use price to earnings ratios (P/E ratios). We'll show how you can use H&R Block, Inc.'s (NYSE:HRB) P/E ratio to inform your assessment of the investment opportunity. Based on the last twelve months, H&R Block's P/E ratio is 13.33. That is equivalent to an earnings yield of about 7.5%.
See our latest analysis for H&R Block
How Do You Calculate A P/E Ratio?
The formula for P/E is:
Price to Earnings Ratio = Share Price ÷ Earnings per Share (EPS)
Or for H&R Block:
P/E of 13.33 = $28.84 ÷ $2.16 (Based on the trailing twelve months to April 2019.)
Is A High P/E Ratio Good?
A higher P/E ratio means that investors are paying a higher price for each $1 of company earnings. That is not a good or a bad thing per se, but a high P/E does imply buyers are optimistic about the future.
Does H&R Block Have A Relatively High Or Low P/E For Its Industry?
The P/E ratio indicates whether the market has higher or lower expectations of a company. If you look at the image below, you can see H&R Block has a lower P/E than the average (26) in the consumer services industry classification.
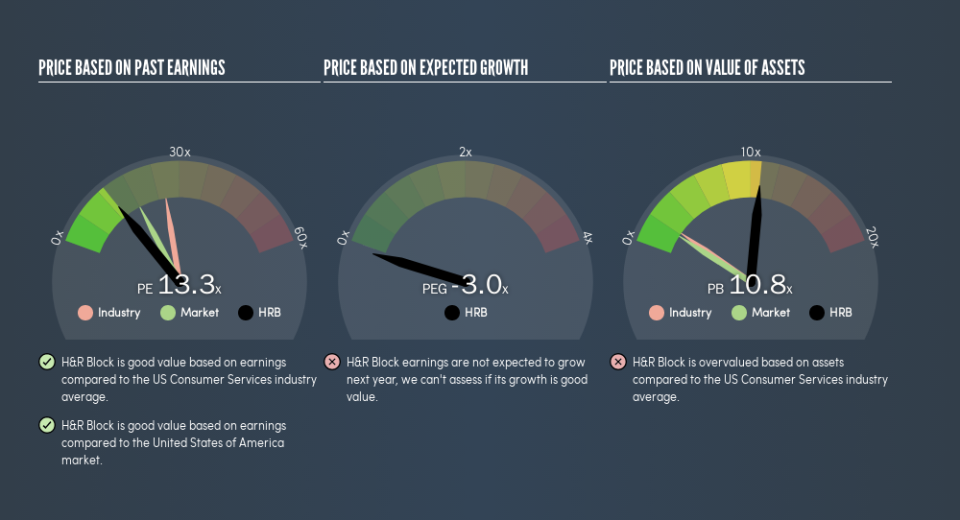
H&R Block's P/E tells us that market participants think it will not fare as well as its peers in the same industry. While current expectations are low, the stock could be undervalued if the situation is better than the market assumes. If you consider the stock interesting, further research is recommended. For example, I often monitor director buying and selling.
How Growth Rates Impact P/E Ratios
Probably the most important factor in determining what P/E a company trades on is the earnings growth. If earnings are growing quickly, then the 'E' in the equation will increase faster than it would otherwise. And in that case, the P/E ratio itself will drop rather quickly. Then, a lower P/E should attract more buyers, pushing the share price up.
H&R Block shrunk earnings per share by 28% over the last year. But it has grown its earnings per share by 3.5% per year over the last five years.
Don't Forget: The P/E Does Not Account For Debt or Bank Deposits
One drawback of using a P/E ratio is that it considers market capitalization, but not the balance sheet. In other words, it does not consider any debt or cash that the company may have on the balance sheet. The exact same company would hypothetically deserve a higher P/E ratio if it had a strong balance sheet, than if it had a weak one with lots of debt, because a cashed up company can spend on growth.
While growth expenditure doesn't always pay off, the point is that it is a good option to have; but one that the P/E ratio ignores.
How Does H&R Block's Debt Impact Its P/E Ratio?
The extra options and safety that comes with H&R Block's US$59m net cash position means that it deserves a higher P/E than it would if it had a lot of net debt.
The Verdict On H&R Block's P/E Ratio
H&R Block's P/E is 13.3 which is below average (18) in the US market. Falling earnings per share are likely to be keeping potential buyers away, but the net cash position means the company has time to improve: if so, the low P/E could be an opportunity.
When the market is wrong about a stock, it gives savvy investors an opportunity. If it is underestimating a company, investors can make money by buying and holding the shares until the market corrects itself. So this free report on the analyst consensus forecasts could help you make a master move on this stock.
Of course you might be able to find a better stock than H&R Block. So you may wish to see this free collection of other companies that have grown earnings strongly.
We aim to bring you long-term focused research analysis driven by fundamental data. Note that our analysis may not factor in the latest price-sensitive company announcements or qualitative material.
If you spot an error that warrants correction, please contact the editor at editorial-team@simplywallst.com. This article by Simply Wall St is general in nature. It does not constitute a recommendation to buy or sell any stock, and does not take account of your objectives, or your financial situation. Simply Wall St has no position in the stocks mentioned. Thank you for reading.
