
 Yahoo Finance
 Greif's (GEF) Earnings Beat, Sales Lag Estimates in Q3, Up Y/Y
Greif, Inc. GEF reported adjusted earnings per share of $1.26 for third-quarter fiscal 2019 (ended Jul 31, 2019), beating the Zacks Consensus Estimate of $1.18. The figure also improved 5% year over year.
The company delivered year-over-year improvement in earnings despite market softness and a weakening industrial economy. Dismal market demand in containerboard operations and in certain segments of Rigid Industrial Packaging business affected the company.
Including one-time items, earnings per share dipped to $1.06 per share from the year-ago quarter’s $1.15.
Operational Update
Sales climbed 23.7% year over year to $1,252.6 million. However, the reported figure lagged the Zacks Consensus Estimate of $1,342 million.
Cost of sales increased 22.4% year over year to $973.2 million. Gross profit came in at $279.4 million, recording an improvement of 28.6% from the prior-year quarter. Gross margin improved to 22.3% from 21.5% in the year-ago quarter.
Selling, general and administrative (SG&A) expenses flared up 39.7% year over year to $139 million. Operating profit increased 10.2% year over year to $125.6 million. Operating margin was 10% in the reported quarter compared with 11% recorded in the prior-year quarter. Adjusted EBITDA increased 39.3% year over year to $203.8 million in the reported quarter.
Greif, Inc. Price, Consensus and EPS Surprise
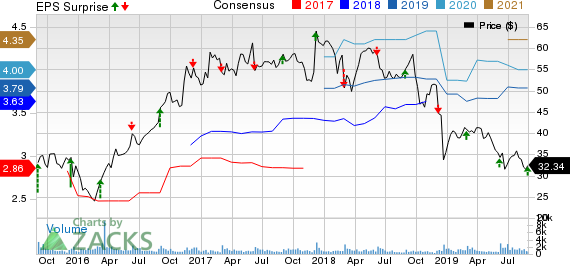
Greif, Inc. price-consensus-eps-surprise-chart | Greif, Inc. Quote
Segmental Performance
Sales in the Rigid Industrial Packaging & Services declined 6.6% year over year to roughly $642 million. The segment’s adjusted EBITDA was in line with the year-ago quarter’s $82.8 million.
The Paper Packaging segment sales soared 124.5%, year over year, to $530 million. This upside was driven by the $320.4-million contribution from the Caraustar acquisition. This was partly offset by lower published containerboard prices and decreased volumes in legacy operations. The segment’s adjusted EBITDA more than doubled to $111 million from $53.1 million reported in the comparable period last year.
Sales at the Flexible Products & Services segment declined 9.8% year over year to $74.5 million. The segment reported adjusted EBITDA of $7.2 million compared with $7.8 million in the year-earlier quarter.
The Land Management segment’s sales inched up 1.7% year over year to $6 million and adjusted EBITDA increased 7.7% year over year to $2.8 million.
Financials
Greif reported cash and cash equivalents of $75.8 million as of Jul 31, 2019, compared with $94.2 million as of Oct 31, 2018. Cash flow from operating activities came in at $141.5 million in the reported quarter compared with $51.3 million reported in the prior-year period.
On Aug 27, Greif’s board of directors announced quarterly cash dividend of 44 cents per share of Class A Common Stock and 66 cents per share of Class B Common Stock. The dividend payout will be made on Oct 1, 2019, to stockholders of record at the close of business on Sep 17.
Outlook
Considering continuous market demand challenges for the remainder of the fiscal year, Greif reaffirmed its adjusted earnings per share guidance for fiscal 2019 at $3.70-$4.00.
Price Performance
Over the past year, Greif’s shares have declined 40.9%, compared to the industry’s decline of 34.7%.

Zacks Rank & Key Picks
Greif currently carries a Zacks Rank #4 (Sell).
A few better-ranked stocks in the Industrial Products sector are Zebra Technologies Corporation ZBRA, Avery Dennison Corporation AVY and Tetra Tech, Inc. TTEK. While Zebra Technologies currently sports a Zacks Rank #1 (Strong Buy), Avery Dennison and Tetra Tech carry a Zacks Rank of 2 (Buy). You can see the complete list of today’s Zacks #1 Rank stocks here.
Zebra Technologies has a projected earnings growth rate of 16.71% for the current year. The stock has gained 25% in a year’s time.
Avery Dennison has an estimated earnings growth rate of 8.42% for 2019. The company’s shares have rallied 8.3% in the past year.
Tetra Tech has an expected earnings growth rate of 15.97% for the ongoing year. The stock has appreciated 48% over the past year.
Breakout Biotech Stocks with Triple-Digit Profit Potential
The biotech sector is projected to surge beyond $775 billion by 2024 as scientists develop treatments for thousands of diseases. They’re also finding ways to edit the human genome to literally erase our vulnerability to these diseases.
Zacks has just released Century of Biology: 7 Biotech Stocks to Buy Right Now to help investors profit from 7 stocks poised for outperformance. Our recent biotech recommendations have produced gains of +98%, +119% and +164% in as little as 1 month. The stocks in this report could perform even better.
See these 7 breakthrough stocks now>>
Want the latest recommendations from Zacks Investment Research? Today, you can download 7 Best Stocks for the Next 30 Days. Click to get this free report
Greif, Inc. (GEF) : Free Stock Analysis Report
Zebra Technologies Corporation (ZBRA) : Free Stock Analysis Report
Avery Dennison Corporation (AVY) : Free Stock Analysis Report
Tetra Tech, Inc. (TTEK) : Free Stock Analysis Report
To read this article on Zacks.com click here.
