
 Yahoo Finance
 Has Greif Inc (NYSE:GEF) Improved Earnings In Recent Times?

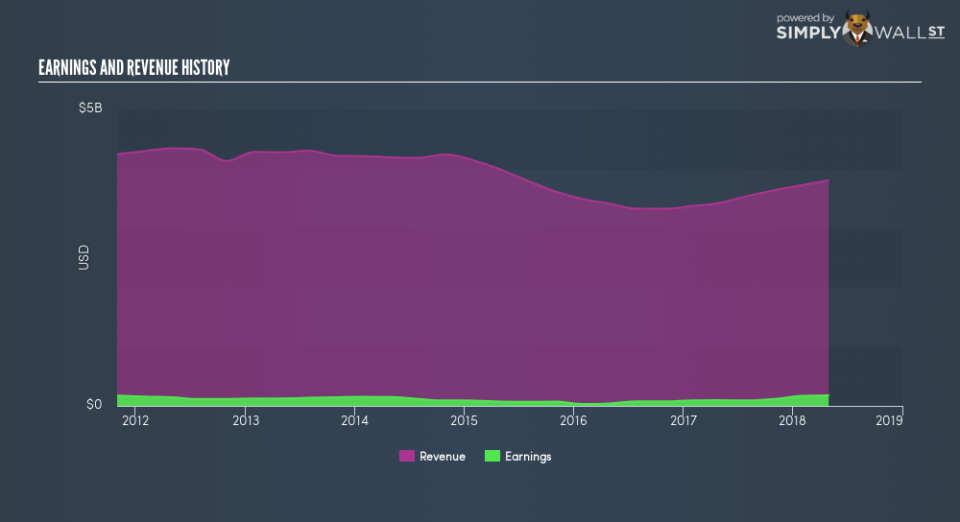
Today I will take a look at Greif Inc’s (NYSE:GEF) most recent earnings update (30 April 2018) and compare these latest figures against its performance over the past few years, as well as how the rest of the packaging industry performed. As an investor, I find it beneficial to assess GEF’s trend over the short-to-medium term in order to gauge whether or not the company is able to meet its goals, and ultimately sustainably grow over time.
View our latest analysis for Greif
How Did GEF’s Recent Performance Stack Up Against Its Past?
GEF’s trailing twelve-month earnings (from 30 April 2018) of US$178.8m has jumped 86.3% compared to the previous year. Furthermore, this one-year growth rate has exceeded its 5-year annual growth average of -6.2%, indicating the rate at which GEF is growing has accelerated. What’s enabled this growth? Well, let’s take a look at if it is merely due to an industry uplift, or if Greif has seen some company-specific growth.
Though both top-line and bottom-line growth rates in the last couple of years were on average negative, earnings were more so. While this resulted in a margin contraction, it has lessened Greif’s earnings contraction. Eyeballing growth from a sector-level, the US packaging industry has been growing its average earnings by double-digit 22.6% in the previous twelve months, and a more muted 5.5% over the last five years. This growth is a median of profitable companies of 25 Packaging companies in US including Nampak, Nampak and Cascades. This means that whatever uplift the industry is enjoying, Greif is capable of amplifying this to its advantage.
In terms of returns from investment, Greif has fallen short of achieving a 20% return on equity (ROE), recording 17.1% instead. However, its return on assets (ROA) of 6.9% exceeds the US Packaging industry of 6.9%, indicating Greif has used its assets more efficiently. And finally, its return on capital (ROC), which also accounts for Greif’s debt level, has increased over the past 3 years from 7.7% to 10.3%. This correlates with a decrease in debt holding, with debt-to-equity ratio declining from 111% to 94.4% over the past 5 years.
What does this mean?
While past data is useful, it doesn’t tell the whole story. While Greif has a good historical track record with positive growth and profitability, there’s no certainty that this will extrapolate into the future. I suggest you continue to research Greif to get a better picture of the stock by looking at:
Future Outlook: What are well-informed industry analysts predicting for GEF’s future growth? Take a look at our free research report of analyst consensus for GEF’s outlook.
Financial Health: Are GEF’s operations financially sustainable? Balance sheets can be hard to analyze, which is why we’ve done it for you. Check out our financial health checks here.
Other High-Performing Stocks: Are there other stocks that provide better prospects with proven track records? Explore our free list of these great stocks here.
NB: Figures in this article are calculated using data from the trailing twelve months from 30 April 2018. This may not be consistent with full year annual report figures.
To help readers see past the short term volatility of the financial market, we aim to bring you a long-term focused research analysis purely driven by fundamental data. Note that our analysis does not factor in the latest price-sensitive company announcements.
The author is an independent contributor and at the time of publication had no position in the stocks mentioned. For errors that warrant correction please contact the editor at editorial-team@simplywallst.com.
