
 Yahoo Finance
 Greif (GEF) Q1 Earnings Lag Estimates, Dip Y/Y on Low Demand
Greif, Inc. GEF reported adjusted earnings per share of $1.06 for first-quarter fiscal 2023, missing the Zacks Consensus Estimate of $1.26. The bottom line decreased 17% year on year owing to lower volume and selling prices.
Including one-time items, EPS was $2.31 in the quarter compared with 25 cents in the prior-year quarter.
Greif, Inc. Price, Consensus and EPS Surprise
Greif, Inc. price-consensus-eps-surprise-chart | Greif, Inc. Quote
Operational Update
Sales were down 19% year over year to $1,271 million due to the lower volume of primary products sold, selling prices, product mix and the impact of changes in foreign currencies against the U.S. Dollar. The top line missed the Zacks Consensus Estimate of $1,284 million.
The cost of sales was down 20% year over year to $1,019 million. Gross profit amounted to $252 million, down 13% from the prior-year quarter’s levels. The gross margin came in at 19.8%, up from last year’s 18.5%.
Selling, general and administrative expenses came in at $139 million compared with the prior-year quarter’s $152 million. Adjusted EBITDA declined 16% year over year to $164.5 million in the fiscal first quarter.
Segmental Performance
Sales in the Global Industrial Packaging segment came in at $706 million compared with the prior-year quarter’s $949 million. The segment’s adjusted EBITDA amounted to $72 million compared with the year-ago quarter’s $114 million. The drop in the results of this segment was mainly due to unfavorable foreign currency translation and lower volumes and selling prices. Also, the sale of the Flexibles Products & Services business negatively impacted the top line of this segment.
The Paper Packaging segment's net sales dipped 8% year over year to $560 million in the fiscal first quarter as lower volumes offset the impact of higher published containerboard and boxboard prices. The segment’s adjusted EBITDA moved up 13% to $91 million from the prior-year quarter’s $81 million.
The Land Management segment’s sales totaled $5 million in the reported quarter compared with $5.2 million in the year-ago quarter. Adjusted EBITDA was $2 million compared with the year-earlier quarter’s $2.1 million.
Financial Position
Greif reported cash and cash equivalents of $161 million at the end of the fiscal first-quarter 2023 compared with $147 million at the end of fiscal 2022. Cash flow from operating activities totaled $33 million in the quarter under review compared with $22 million in the prior year quarter.
Long-term debt amounted to $2,144 million as of Jan 31, 2023, compared with $1,839 million as of Oct 31, 2021.
GEF has completed the previously announced acquisition of Lee Container Corporation. The integration is underway and the company expects to realize synergies of at least $6 million. The company also announced that it has entered into an agreement to increase its current stake of 9% in Centurion Container LLC, to 80% in an all-cash transaction for $145 million. Greif has been a joint venture partner of Centurion since 2020.
On Feb 28, Greif’s board announced a quarterly cash dividend of 50 cents per share of Class A Common Stock and 75 cents per share of Class B Common Stock. The dividend will be paid out on Apr 1, 2023, to shareholders of record at the close of business as of Mar 17, 2022.
Outlook
Considering the decline in product demand witnessed over the past two quarters and ongoing uncertainty in the macro-economic environment, Greif has provided only the low end of the guidance range for fiscal 2023. The projected low-end figure for adjusted EBITDA is at $740 million and for adjusted free cash flow is at $370 million.
Price Performance
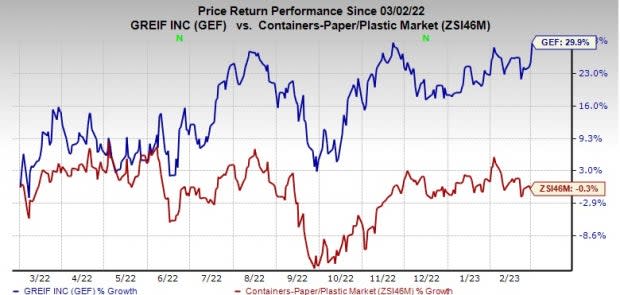
Image Source: Zacks Investment Research
Greif’s shares have gained 29.9% in a year’s time against the industry’s 0.3% decline.
Zacks Rank & Stocks to Consider
Greif currently carries a Zacks Rank #4 (Sell).
Some better-ranked stocks from the Industrial Products sector are OI Glass OI, Tenaris TS and Deere & Company DE. OI and TS sport a Zacks Rank #1 (Strong Buy) at present, and DE has a Zacks Rank #2 (Buy). You can see the complete list of today’s Zacks #1 Rank stocks here.
OI Glass has an average trailing four-quarter earnings surprise of 16.4%. The Zacks Consensus Estimate for OI’s 2023 earnings is pegged at $2.57 per share. This indicates an 11.7% increase from the prior-year reported figure. The consensus estimate for 2023 earnings has moved 16% north in the past 60 days. OI’s shares gained 79.2% in the last year.
Tenaris has an average trailing four-quarter earnings surprise of 11.5%. The Zacks Consensus Estimate for TS’ 2023 earnings is pegged at $6.04 per share. This indicates a 39.5% increase from the prior-year reported figure. The consensus estimate for 2023 earnings has moved north by 17% in the past 60 days. Its shares gained 26.1% in the last year.
The Zacks Consensus Estimate for Deere & Company’s fiscal 2023 earnings per share is pegged at $29.82, suggesting an increase of 28.1% from that reported in the last year. The consensus estimate for fiscal 2023 earnings moved 6% upward in the last 60 days. DE has a trailing four-quarter average earnings surprise of 4.7%. Its shares gained 11.6% in the last year.
Want the latest recommendations from Zacks Investment Research? Today, you can download 7 Best Stocks for the Next 30 Days. Click to get this free report
Greif, Inc. (GEF) : Free Stock Analysis Report
O-I Glass, Inc. (OI) : Free Stock Analysis Report
Deere & Company (DE) : Free Stock Analysis Report
Tenaris S.A. (TS) : Free Stock Analysis Report
