
 Yahoo Finance
 Greif (GEF) Misses on Q2 Earnings & Revenues, Lifts EPS View


Greif, Inc. GEF delivered adjusted earnings of 76 cents per share for second-quarter fiscal 2018 (ended Apr 30, 2018) which improved 13% year over year. However, earnings fell short of the Zacks Consensus Estimate of 84 cents by a margin of 17%.
Including one-time items, the company posted earnings of 77 cents per share compared with 61 cents per share recorded in the year-ago quarter.
Operational Update
Revenues increased 9% year over year to $968 million from $887 million generated in the prior-year quarter. Revenues missed the Zacks Consensus Estimate of $976 million.
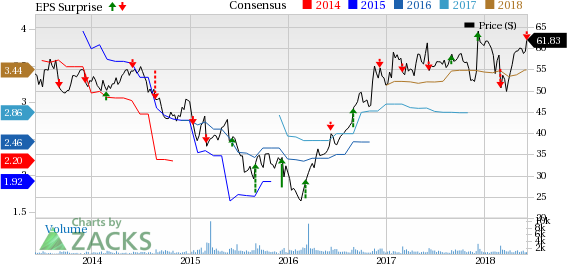
Greif, Inc. Price, Consensus and EPS Surprise
Greif, Inc. Price, Consensus and EPS Surprise | Greif, Inc. Quote
Cost of sales rose 10% year over year to $773 million. Gross profit improved 7% to $195 million from $182 million reported in the year-ago quarter. Gross margin contracted 40 basis points (bps) to 20.1% in the quarter.
Selling, general and administrative (SG&A) expenses were up 6% year over year to $103 million. Adjusted operating profit improved 9% year over year to $93 million. Adjusted operating margin remained flat year over year at 9.6% in the reported quarter.
Segmental Performance
Rigid Industrial Packaging & Services: The segment reported sales of $663 million, up 6% from $624 million recorded in the comparable quarter last fiscal. Net sales increased primarily due to a 4.5% rise in selling prices on the company’s primary products as a result of strategic pricing decisions and increases in index prices. Adjusted operating profit dropped 13% year over year to $53 million from $60.3 million due to raw material cost inflation and an increase in manufacturing and transportation costs.
Paper Packaging: Sales for the segment were up 13% year over year to $214 million, driven by increase in selling prices owing to improvement in published containerboard pricing and higher volumes. The segment reported adjusted operating profit of $33 million, surging around 63% year over year, supported by higher containerboard prices and lower old corrugated container input costs, partially offset by a rise in transportation costs.
Flexible Products & Services: Sales from this segment rose 26% year over year to $84 million primarily backed by the company’s strategic pricing decisions, product mix and higher volumes. The segment reported adjusted operating profit of $5 million, a substantial improvement from $3 million witnessed in the year-earlier quarter.
Land Management: The segment’s sales declined 3% to $7.6 million from $7.8 million recorded in the prior-year quarter. Adjusted operating income improved 11% year over year to $2 million.
Financial Position
Greif ended the fiscal second quarter with cash and cash equivalents of $108 million compared with $142.3 million as of Oct 31, 2016. Cash flow from operations came in at $58 million during the six-month period ended Apr 30, 2018, compared with $60 million reported in the comparable period last year.
On Jun 5, 2018, Greif’s board of directors announced quarterly cash dividends of 42 cents per share of Class A Common Stock and 63 cents per share of Class B Common Stock. Dividends are payable on Jul 1, to stockholders of record at the close of business on Jun 18, 2018.
Guidance
Greif raised its adjusted earnings per share guidance for fiscal 2018 to $3.45-$3.70 from $3.25-$3.55, on the back of improved price/cost balance in containerboard. The company also raised its capital expenditure outlook to $120-$140 from $100-$120 buoyed by new growth projects. It maintained free cash flow guidance of $200-$220 million for fiscal 2018.
Share Price Performance
Over the past year, Greif has underperformed its industry with respect to price performance. The stock has gained 3%, while the industry has recorded growth of 4%.
Zacks Rank & Other Stocks to Consider
Greif currently carries a Zacks Rank #2 (Buy).
Some other top-ranked stocks in the same sector are Axon Enterprise, Inc AAXN, Caterpillar Inc. CAT and Terex Corporation TEX. All three stocks sport a Zacks Rank #1 (Strong Buy). You can see the complete list of today’s Zacks #1 Rank stocks here.
Axon Enterprise has a long-term earnings growth rate of 25%. Its shares have appreciated 180%, over the past year.
Caterpillar has a long-term earnings growth rate of 13.3%. The company’s shares have been up 51% in the past year.
Terex has a long-term earnings growth rate of 21%. The stock has gained 21% in a year’s time.
Will You Make a Fortune on the Shift to Electric Cars?
Here's another stock idea to consider. Much like petroleum 150 years ago, lithium power may soon shake the world, creating millionaires and reshaping geo-politics. Soon electric vehicles (EVs) may be cheaper than gas guzzlers. Some are already reaching 265 miles on a single charge.
With battery prices plummeting and charging stations set to multiply, one company stands out as the #1 stock to buy according to Zacks research.
It's not the one you think.
See This Ticker Free >>
Want the latest recommendations from Zacks Investment Research? Today, you can download 7 Best Stocks for the Next 30 Days. Click to get this free report
Greif, Inc. (GEF) : Free Stock Analysis Report
Terex Corporation (TEX) : Free Stock Analysis Report
Caterpillar Inc. (CAT) : Free Stock Analysis Report
Axon Enterprise, Inc (AAXN) : Free Stock Analysis Report
To read this article on Zacks.com click here.
