
 Yahoo Finance
 Good Life Networks Inc (CVE:GOOD): Time For A Financial Health Check

Good Life Networks Inc (CVE:GOOD) is a small-cap stock with a market capitalization of CA$14.14m. While investors primarily focus on the growth potential and competitive landscape of the small-cap companies, they end up ignoring a key aspect, which could be the biggest threat to its existence: its financial health. Why is it important? Companies operating in the Internet industry, especially ones that are currently loss-making, are inclined towards being higher risk. Assessing first and foremost the financial health is crucial. I believe these basic checks tell most of the story you need to know. Though, since I only look at basic financial figures, I’d encourage you to dig deeper yourself into GOOD here.
How does GOOD’s operating cash flow stack up against its debt?
GOOD’s debt levels have fallen from CA$1.75m to CA$848.85k over the last 12 months , which is made up of current and long term debt. With this debt payback, the current cash and short-term investment levels stands at CA$2.94m , ready to deploy into the business. Moving onto cash from operations, its trivial cash flows from operations make the cash-to-debt ratio less useful to us, though these low levels of cash means that operational efficiency is worth a look. For this article’s sake, I won’t be looking at this today, but you can take a look at some of GOOD’s operating efficiency ratios such as ROA here.
Can GOOD pay its short-term liabilities?
With current liabilities at CA$6.70m, the company has maintained a safe level of current assets to meet its obligations, with the current ratio last standing at 1.6x. Generally, for Internet companies, this is a reasonable ratio since there’s sufficient cash cushion without leaving too much capital idle or in low-earning investments.
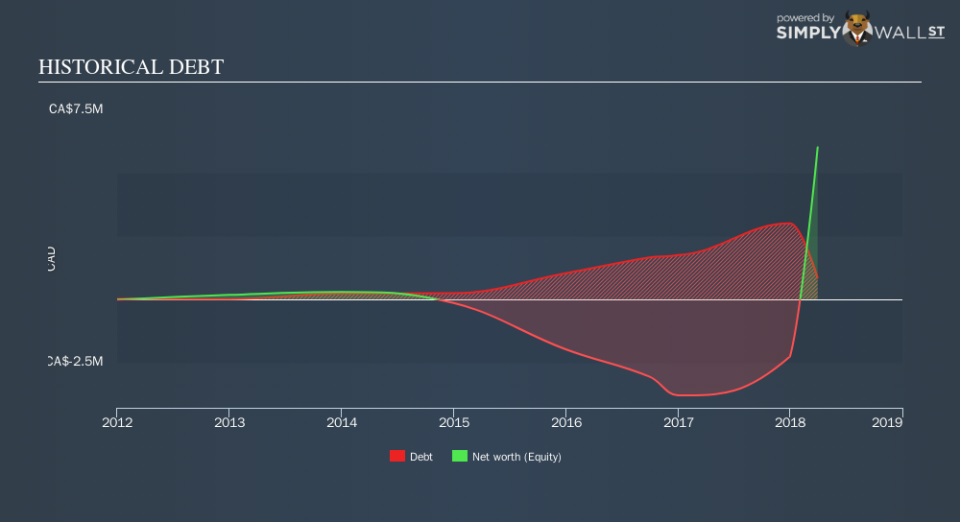
Is GOOD’s debt level acceptable?
GOOD’s level of debt is appropriate relative to its total equity, at 14.14%. GOOD is not taking on too much debt commitment, which can be restrictive and risky for equity-holders. Risk around debt is very low for GOOD, and the company also has the ability and headroom to increase debt if needed going forward.
Next Steps:
GOOD’s cash flow coverage indicates it could improve its operating efficiency in order to meet demand for debt repayments should unforeseen events arise. However, the company exhibits an ability to meet its near term obligations should an adverse event occur. I admit this is a fairly basic analysis for GOOD’s financial health. Other important fundamentals need to be considered alongside. You should continue to research Good Life Networks to get a more holistic view of the stock by looking at:
Historical Performance: What has GOOD’s returns been like over the past? Go into more detail in the past track record analysis and take a look at the free visual representations of our analysis for more clarity.
Other High-Performing Stocks: Are there other stocks that provide better prospects with proven track records? Explore our free list of these great stocks here.
To help readers see past the short term volatility of the financial market, we aim to bring you a long-term focused research analysis purely driven by fundamental data. Note that our analysis does not factor in the latest price-sensitive company announcements.
The author is an independent contributor and at the time of publication had no position in the stocks mentioned. For errors that warrant correction please contact the editor at editorial-team@simplywallst.com.
