
 Yahoo Finance
 What Is Good Energy Group's (LON:GOOD) P/E Ratio After Its Share Price Rocketed?

Good Energy Group (LON:GOOD) shareholders are no doubt pleased to see that the share price has bounced 46% in the last month alone, although it is still down 23% over the last quarter. That brought the twelve month gain to a very sharp 55%.
All else being equal, a sharp share price increase should make a stock less attractive to potential investors. In the long term, share prices tend to follow earnings per share, but in the short term prices bounce around in response to short term factors (which are not always obvious). The implication here is that deep value investors might steer clear when expectations of a company are too high. One way to gauge market expectations of a stock is to look at its Price to Earnings Ratio (PE Ratio). Investors have optimistic expectations of companies with higher P/E ratios, compared to companies with lower P/E ratios.
View our latest analysis for Good Energy Group
Does Good Energy Group Have A Relatively High Or Low P/E For Its Industry?
Good Energy Group's P/E is 24.19. The image below shows that Good Energy Group has a P/E ratio that is roughly in line with the renewable energy industry average (26.0).
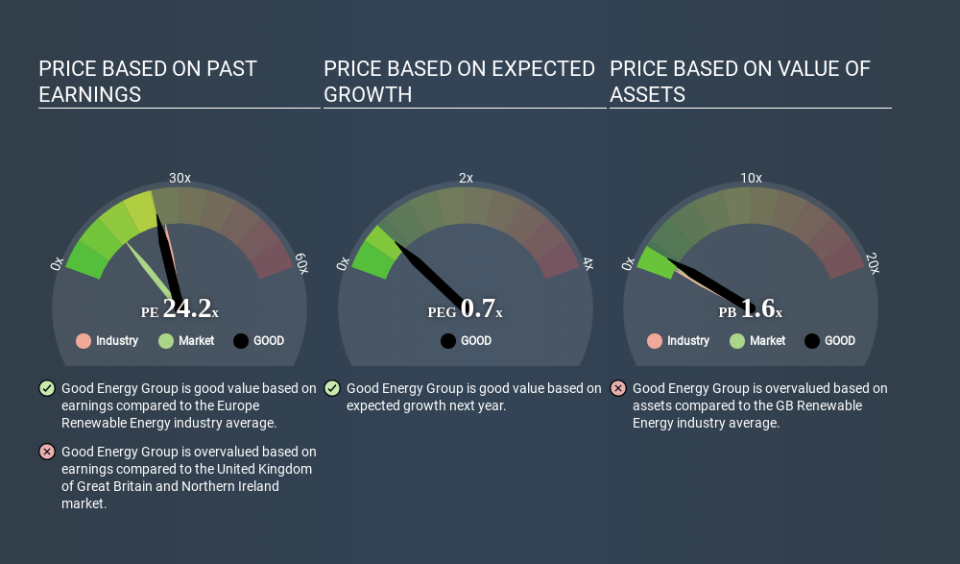
That indicates that the market expects Good Energy Group will perform roughly in line with other companies in its industry. The company could surprise by performing better than average, in the future. Checking factors such as director buying and selling. could help you form your own view on if that will happen.
How Growth Rates Impact P/E Ratios
When earnings fall, the 'E' decreases, over time. That means even if the current P/E is low, it will increase over time if the share price stays flat. Then, a higher P/E might scare off shareholders, pushing the share price down.
Good Energy Group shrunk earnings per share by 27% over the last year. And it has shrunk its earnings per share by 10.0% per year over the last five years. This might lead to muted expectations.
Remember: P/E Ratios Don't Consider The Balance Sheet
It's important to note that the P/E ratio considers the market capitalization, not the enterprise value. Thus, the metric does not reflect cash or debt held by the company. Hypothetically, a company could reduce its future P/E ratio by spending its cash (or taking on debt) to achieve higher earnings.
Spending on growth might be good or bad a few years later, but the point is that the P/E ratio does not account for the option (or lack thereof).
How Does Good Energy Group's Debt Impact Its P/E Ratio?
Good Energy Group's net debt is considerable, at 140% of its market cap. This level of debt justifies a relatively low P/E, so remain cognizant of the debt, if you're comparing it to other stocks.
The Verdict On Good Energy Group's P/E Ratio
Good Energy Group trades on a P/E ratio of 24.2, which is above its market average of 13.3. With significant debt and no EPS growth last year, shareholders are betting on an improvement in earnings from the company. What we know for sure is that investors have become much more excited about Good Energy Group recently, since they have pushed its P/E ratio from 16.5 to 24.2 over the last month. For those who prefer to invest with the flow of momentum, that might mean it's time to put the stock on a watchlist, or research it. But the contrarian may see it as a missed opportunity.
Investors should be looking to buy stocks that the market is wrong about. As value investor Benjamin Graham famously said, 'In the short run, the market is a voting machine but in the long run, it is a weighing machine. So this free visualization of the analyst consensus on future earnings could help you make the right decision about whether to buy, sell, or hold.
Of course you might be able to find a better stock than Good Energy Group. So you may wish to see this free collection of other companies that have grown earnings strongly.
If you spot an error that warrants correction, please contact the editor at editorial-team@simplywallst.com. This article by Simply Wall St is general in nature. It does not constitute a recommendation to buy or sell any stock, and does not take account of your objectives, or your financial situation. Simply Wall St has no position in the stocks mentioned.
We aim to bring you long-term focused research analysis driven by fundamental data. Note that our analysis may not factor in the latest price-sensitive company announcements or qualitative material. Thank you for reading.
