
 Yahoo Finance
 Gold Technical Analysis: Rally Approaching Critical Resistance at 1278
DailyFX.com -
Talking Points
Gold rally eyeing critical long-term resistance range- longs at risk into 1278
Check out the DailyFX Trading Guides and Webinars for ideas and education.
Gold Daily

Gold is attempting to close above the 200-day moving average for the first time this year & after five failed attempts. The focus now shifts to critical resistance highlighted last week around 1278- this region is defined by the 100% ext of the advance off the December lows & the 61.8% retracement of the decline off the 2016 high and converges on key longer-term slope lines extending off the 2011 record highs & the 2016 high.
Bottom line: gold is coming into some serious resistance here with the long bias at risk heading into this key region. Interim support now back at the 200-day moving average with a break sub-1241 needed to shift the medium-term focus lower. From a trading standpoint, I’ll be looking for exhaustion / short-triggers on a move into the upper parallels. That said, if we break higher there’s open range to the May highs at 1303.
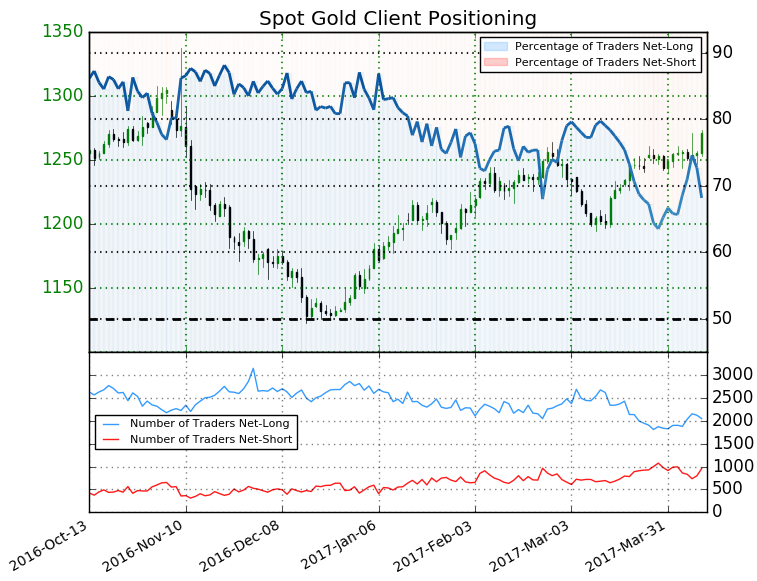
A summary of the DailyFX Speculative Sentiment Index (SSI) shows traders are net-long Gold- the ratio stands at +2.14 (68.2% of traders are long)- bearish reading
Long positions are 6.1% lower than yesterday but 5.3% higher from last week
Short positions are 10.7% higher than yesterday and 7.7% lower from last week
Despite the fact retail remains net-long, the recent build in short positioning continues to highlight the immediate topside bias- but look for this to change as prices approach key resistance.
---Written by Michael Boutros, Currency Strategist with DailyFX
Follow Michaelon Twitter @MBForex contact him at mboutros@dailyfx.com or Click Here to be added to his email distribution list.
DailyFX provides forex news and technical analysis on the trends that influence the global currency markets.
Learn forex trading with a free practice account and trading charts from IG.
