
 Yahoo Finance
 Gold is saying: Get ready for upside!
It has been quite a while since looking at a price chart of gold has lead me to think it has serious upside potential. When I look at gold today, I see what looks to be a nice upside move setting up. I want to share some simple technical analysis to make a case for why gold looks bullish and how to participate.
This piece is focused simply on price action and the psychology which shapes it. Beyond this sentence there will be no mention of: inflation, monetary policy, asset allocation, etc. The analysis here will be centered around two different timeframes: weekly and daily.
When we use multiple timeframe analysis, we first consult the longer-term timeframe to develop our overall thesis, and then we drill down to shorter timeframes to develop our plan. Once we have established our plan, our job is to wait for evidence that our plan has developed to the point where it provides us with an acceptable risk/reward to take action.
Let’s look at a longer-term chart first. The chart below shows the price action of spot gold prices since 2004. Each candle on the chart combines the price action of 10 trading days. Overlaid on this chart is a 20-period (each period being 10 days) or 200-day moving average. Notice a few things on this chart.
Gold (spot price) – 10 day candlestick – 13 years

The numbered points on the chart above are detailed in the bullets below. If price numbers are not clear due to scaling look to the next chart.
Gold was in a major bull market up until early 2013 when it made a lower low below the 200-day (blue) moving average.
The higher lows from late 2016 show that buyers are becoming more aggressive price wise. No longer are they waiting for a pullback to 1,100 1,200 1,250 or even 1,300 before they regain control. These higher lows show increased demand at higher levels; that is bullish.
It is taking less time between tests of resistance between 1,350-1,380. This level was tested in July of 2016 and then 14 months later in August of 2017 and then just four months later in January of this year. The more frequent tests of the supply area indicate the buyers are becoming more time-wise and are likely to regain control in the near term as they chew through that supply.
If gold trades above the resistance at 1,380, it will occur with a rising 200-day moving average which would confirm the buyers have finally regained control of the longer-term trend.
On the way down, gold traded very little volume from 1,600 down to 1,400. This is significant because there is little “price memory” in that area. Less volume on the way down should make it easier for gold to climb higher without much chance of supply being released from people who bought in that area and are now trying to get out breakeven.
Now that we have determined the weekly timeframe, it gives us reasons to look more closely at the price action in gold. We will study the daily timeframe to start to get a better sense of timing a purchase. The chart below shows the daily price (each candle shows the trading of one day) of gold from July of 2017 through Monday February 12, 2018.
Gold (spot price) – 1 day candlestick – 8 months
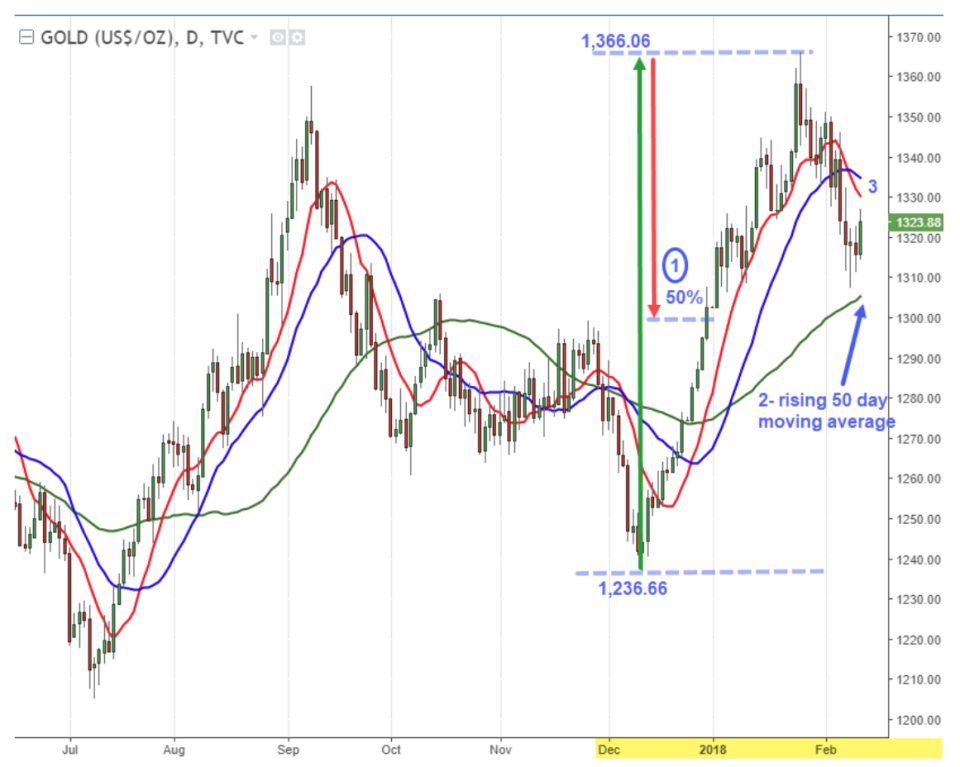
On the daily chart, we have three moving averages: a 10 (red), 20 (blue) and 50 (green.) Look to the numbers on the chart above to clarify the following points.
From the December low to the January high, gold has only retraced 50% of that mov. This is well within what is considered a normal, healthy pullback.
The pullback has held above the rising 50-day moving average. The direction of this moving average shows the trend of the last 50 days continues to be higher.
The shorter-term (10 & 20) moving averages are sloped lower. This indicates the near-term profit-taking has not completed. Once gold can climb back above these moving averages (and they flatten to turn higher) we can assume the profit taking of the last 2 weeks has been absorbed.
Possible trading plans for different timeframe participants
If you are a long-term (potential holding time of years) investor, you might want to start accumulating in this area. I personally would not continue to hold if the price were to make a lower low on the weekly timeframe. In plain English, I would use a stop under the December 2017 low of 1,236.
If you are an intermediate term (months) trader you could buy some in this current area and then add to a breakout above the 2018 high of 1,366.06. Buying some now with a stop below the December low would help provide a lower cost versus buying the whole amount on a break of the 2018 high.
If you are a shorter-term momentum trader (weeks) then you might want to wait for confirmation that a higher high is made above the rising 200-day moving average. A move above the 1,366.06 high would be confirmation of the higher high. After a higher low is made, I would place a stop below the rising 50-day moving average.
How to trade gold
The way I see it, there are three possible ways to trade gold.
You could use the SPDR Gold Trust (GLD) which trades at approximately 1/10th the price of physical gold.
You could use Gold futures contracts (GC=F).
You could buy physical gold coins.
For me, I prefer to trade in physical bullion, and the best site I have found to do that is www.golddealer.com. I have used this company for over 15 years, and I trust them.
Whatever way you decide to get involved in gold, or if you don’t get involved at all, I encourage you to do your own research and use this information as part of your decision-making process. Trade well and manage risk!
Read more from Brian Shannon
Veteran trader shares 11 market truths for stock investors
3 lessons from Bill Ackman’s $4B trading loss in Valeant
Biotech stocks are turning bullish—here’s how to profit
