
 Yahoo Finance
 Gold Price: Running into Resistance - Big Picture Down-Trend Intact
DailyFX.com -
To receive James Stanley’s Analysis directly via email, please sign up here.
Talking Points:
Gold Technical Strategy: Flat
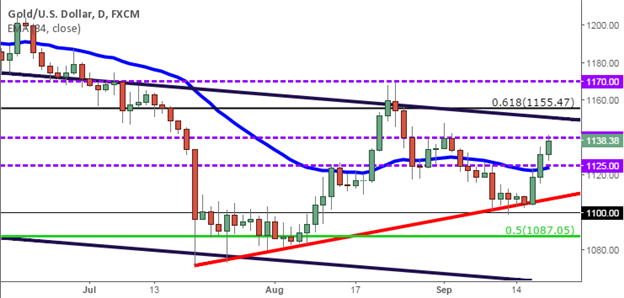
Gold is continuing to trade higher after a vigorous bounce off of trend-line support.
Short-sellers could find entries attractive provided price remains below the prior ‘lower-high’ at $1,147.83.
In Wednesday’s piece, we looked at the vigorous bounce that Gold put in off trend-line support, connecting the higher-lows that had established in the market since a low was established in July. And after three consecutive days of higher prices combined with aggressive price action, those looking to sell the yellow metal may be nearing a potential entry point. As noted in Wednesday’s piece, the pace with which Gold has moved higher should not be underestimated by potential short-sellers. Resistance has begun to come in off of the $1,140 level, but until more certain resistance shows an attractive risk-reward ratio may not be present.
For short-sellers, targets at $1,125 (psychological support level), $1,110 (projected trend-line support), and then $1,100 (psychological level and the last ‘higher-low’ before Gold shot higher) could prove attractive. Prior price action resistance at $1,147.50 could provide anchoring of stops on potential short positions.
Alternatively, should Gold continue trading higher to eventually break the previous lower-high at $1,147.83; traders can look to the long side of the market with targets set at $1,155.47 (61.8% Fibonacci retracement of the ‘secondary move,’ taking the low from 2008 to the highs of 2011), $1,170 (psychological level and prior price action resistance), $1,200 and then $1,250 (both psychological levels that have had a tendency to provide support/resistance in Gold).
--- Written by James Stanley, Analyst for DailyFX.com
To receive James Stanley’s analysis directly via email, please SIGN UP HERE
Contact and follow James on Twitter: @JStanleyFX
DailyFX provides forex news and technical analysis on the trends that influence the global currency markets.
Learn forex trading with a free practice account and trading charts from FXCM.
