
 Yahoo Finance
 Gold Price Futures (GC) Technical Analysis – Key Pivot Support at $1300.50 Must Hold to Sustain Upside Bias
A surge in the U.S. Dollar is driving gold off its high as we approach the close on Thursday. An expected jump in the greenback caught a few of the weaker gold longs by surprise, forcing them to aggressively exit their positions. Some investors bought gold on Wednesday when the Fed released its dovish announcements, thinking the news would drive the dollar lower, while increasing demand for dollar-denominated gold.
Instead, the greenback surged and gold weakened after the number of Americans filing applications for unemployment benefits fell more than expected last week, and the Philly Fed report, a measure of factory activity in the mid-Atlantic region, rebounded sharply in March after a big drop last month.
At 19:54 GMT, April Comex gold is trading $1309.00, up $7.30 or +0.55%.
Daily Technical Analysis
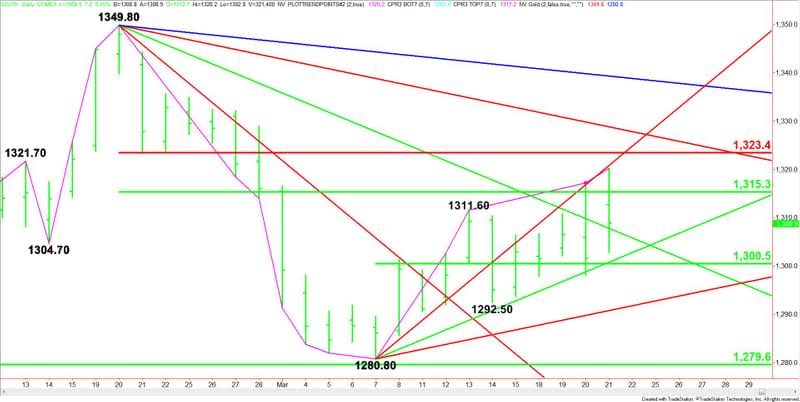
The main trend is down according to the daily swing chart. However, momentum is trending higher. The main trend will change to up on a trade through $1349.80. A move through $1280.80 will reaffirm the downtrend.
The minor trend is up. This is helping to support the upside momentum. A trade through $1292.50 will change the minor trend to down and shift momentum to the downside.
The main range is $1349.80 to $1280.80. Its retracement zone at $1315.30 to $1323.40 provided resistance earlier in the session when sellers came in at $1320.20, producing today’s high.
The short-term range is $1280.80 to $1320.20. Its 50% level or pivot at $1300.50 is controlling the near-term direction of the market.
Daily Technical Forecast
Based on the current price at $1309.00, the key downtrending angle to watch into the close is $1307.80.
Closing over $1307.80 will give the market a slight upside bias. If this is able to generate enough upside momentum then look for a potential late session rally into the main 50% level at $1315.30.
A close under $1307.80 will be a sign of weakness. This could drive gold into the uptrending Gann angle at $1300.80, followed closely by the short-term pivot at $1300.50. This combination actually forms a support cluster.
This article was originally posted on FX Empire
More From FXEMPIRE:
USD/CAD Overview – The Pair Breaking Last Day’s Major Resistance
E-mini Dow Jones Industrial Average (YM) Futures Technical Analysis – March 21, 2019 Forecast
Crude Oil Price Update – Trying to Establish Support Over Major 50% Level at $59.63
Natural Gas Price Forecast – Natural gas markets continue to drift lower
USD/JPY Price Forecast – US dollar pulls back against Japanese yen
