
 Yahoo Finance
 Gold Price Futures (GC) Technical Analysis – Reaction to $1889.70 – $1842.60 Retracement Zone Sets the Tone
Gold futures finished lower on Friday after failing to follow-through to the upside following Thursday’s potentially bullish closing price reversal bottom. The catalyst behind today’s decline was a stronger U.S. Dollar. Bullion also posted its steepest weekly contraction since March.
On Friday, December Comex gold settled at $1866.30, down $10.60 or -0.56%
Gold posted a closing price reversal bottom on Thursday after the dollar index rally into a two-month high lost steam as it approached a key resistance area. Nonetheless, the dollar remained on course for its biggest weekly gains since early April.
The news that the Democrats were working on a $2.4 trillion stimulus package, after U.S. Fed officials urged for more fiscal stimulus, offered some respite to investors’ hopes, but skeptical gold buyers failed to bite on the story.
Daily Swing Chart Technical Analysis
The main trend is down according to the daily swing chart, however, momentum may be getting ready to shift to the upside with the formation of the closing price reversal bottom on Thursday.
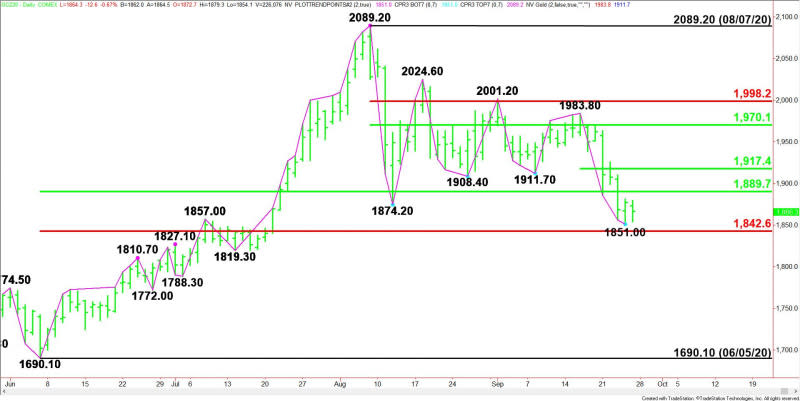
A trade through $1851.00 will negate the closing price reversal top and signal a resumption of the downtrend.
A move through yesterday’s high at $1880.90 will confirm the closing price reversal bottom. The move won’t change the main trend to up, but it could trigger the start of a 2 to 3 day counter-trend rally.
The main range is $1690.10 to $2089.20. Its retracement zone at $1889.70 to $1842.60 is currently being tested. Trader reaction to this zone will determine the near-term direction of the market.
The minor range is $1983.80 to $1851.00. Its 50% level at $1917.40 is the first potential upside target.
Daily Swing Chart Technical Forecast
Based on Thursday and Friday’s price action, the near-term direction of the December Comex gold futures contract is likely to be determined by trader reaction to $1851.10 and $1880.90.
Bearish Scenario
A sustained move under $1851.10 will negate the closing price reversal bottom and signal a resumption of the downtrend. This should lead to a test of the Fibonacci level at $1842.60. This is a potential trigger point for an acceleration into a main bottom at $1819.30.
Bullish Scenario
Taking out $1880.90 will confirm the closing price reversal top. This could lead to a quick test of the main 50% level at $1889.70. This is a potential trigger point for an acceleration to the upside with $1917.40 the next potential upside target.
For a look at all of today’s economic events, check out our economic calendar.
This article was originally posted on FX Empire
More From FXEMPIRE:
Ethereum, Litecoin, and Ripple’s XRP – Daily Tech Analysis – September 26th, 2020
USD/JPY Forex Technical Analysis – Big Decision for Buyers at 105.526 to 105.885
Natural Gas Price Prediction – Prices Slip But the Weather is Forecast to be Colder
S&P 500 Weekly Price Forecast – Find Footing Late in the Week
