
 Yahoo Finance
 Gold Price Futures (GC) Technical Analysis – Deep Plunge Sets Up Eventual Test of $1251.90
Gold futures plunged on Friday after long investors threw in the towel and liquidated positions aggressively in reaction to several key central bank decisions earlier in the week from the U.S. Federal Reserve, the European Central Bank and the Bank of Japan.
August Comex Gold futures settled at $1278.50, down $29.80 or -2.33%.

Daily Swing Chart Technical Analysis
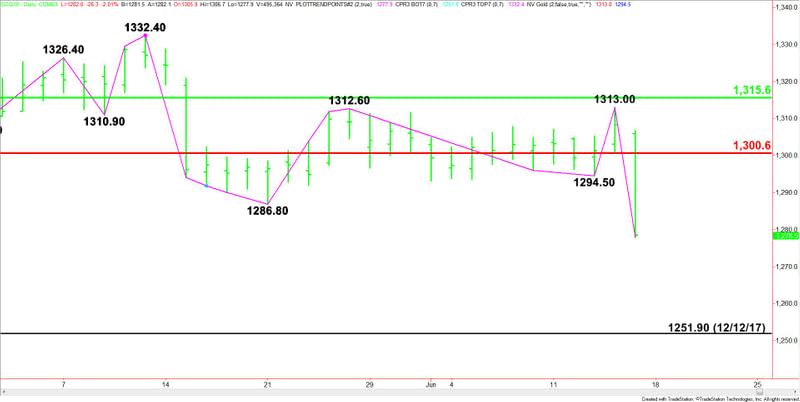
The main trend is down according to the daily swing chart. The downtrend was reaffirmed on Friday when sellers took out main swing bottoms at $1294.50 and $1286.80. The new main top is $1313.00.
Gold had been rangebound since May 21, holding inside the $1332.40 to $1286.80 range for 17 trading sessions. This chart pattern suggested investor indecision and impending volatility, however, there seemed to be a slight upside bias developing due to the series of progressively higher bottoms. It was these counter-trend buyers that likely blew out of their long positions via sell stops to fuel the price plunge.
The main range is formed by the December 12, 2017 main bottom at $1251.90 and the January 25, 2018 top at $1379.30. Its retracement zone at $1315.60 to $1300.60 is resistance.
Daily Swing Chart Technical Forecast
Based on the close at $1278.50, the direction of the gold market on Monday is likely to be determined by trader reaction to the main bottom at $1286.80. If longs have been taken out and new shorts have entered then they are likely to defend this price since old bottoms tend to become new tops.
A sustained move under $1286.80 will indicate the presence of sellers. If the selling pressure continues then we should see an eventual break into the December 12 main bottom at $1251.90.
A sustained move over $1286.80 will signal the return of buyers. It will also indicate that Friday’s break was primarily fueled by sell stops rather than new sellers. The next upside target is another main bottom at $1294.50, followed by the Fibonacci level at $1300.60, the main top at $1313.00 and the 50% level at $1315.60.
Watch the price action and read the order flow at $1286.80 on Monday. Trader reaction to this level will set the tone for the day.
This article was originally posted on FX Empire
More From FXEMPIRE:
Oil Price Fundamental Weekly Forecast – Traders Pricing in 1 Millon Bpd OPEC Production Increase
S&P 500 Weekly Price Forecast – S&P 500 very noisy during the week
Dow Jones 30 and NASDAQ 100 Weekly Price Forecast – overall bullish attitude remains
Divergence Between Fed and ECB, BOJ Policies Drives Forex Volatility
Silver Weekly Price Forecast – Silver markets giveback massive gains during the week
DAX Weekly Price Forecast – German index rallies for the week
