
 Yahoo Finance
 Is Gildan Activewear Inc. (TSE:GIL) A Great Dividend Stock?

Want to participate in a short research study? Help shape the future of investing tools and you could win a $250 gift card!
Could Gildan Activewear Inc. (TSE:GIL) be an attractive dividend share to own for the long haul? Investors are often drawn to strong companies with the idea of reinvesting the dividends. On the other hand, investors have been known to buy a stock because of its yield, and then lose money if the company's dividend doesn't live up to expectations.
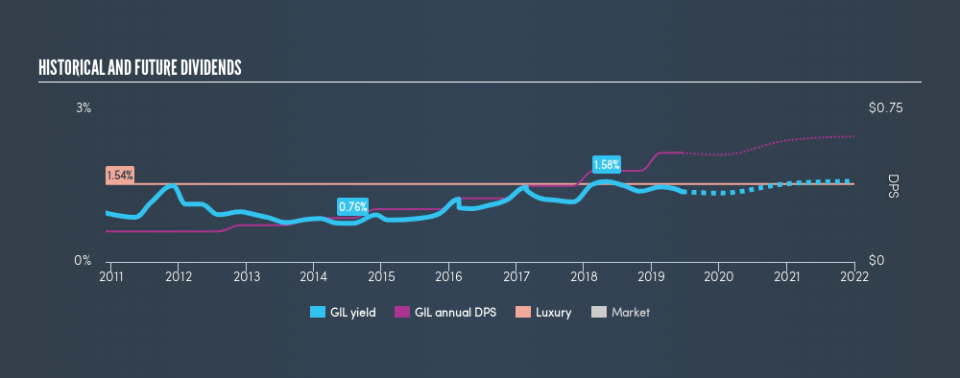
With a 1.4% yield and a nine-year payment history, investors probably think Gildan Activewear looks like a reliable dividend stock. A low yield is generally a turn-off, but if the prospects for earnings growth were strong, investors might be pleasantly surprised by the long-term results. The company also bought back stock during the year, equivalent to approximately 4.0% of the company's market capitalisation at the time. Some simple analysis can reduce the risk of holding Gildan Activewear for its dividend, and we'll focus on the most important aspects below.
Explore this interactive chart for our latest analysis on Gildan Activewear!
Payout ratios
Dividends are typically paid from company earnings. If a company pays more in dividends than it earned, then the dividend might become unsustainable - hardly an ideal situation. Comparing dividend payments to a company's net profit after tax is a simple way of reality-checking whether a dividend is sustainable. Looking at the data, we can see that 34% of Gildan Activewear's profits were paid out as dividends in the last 12 months. This is a middling range that strikes a nice balance between paying dividends to shareholders, and retaining enough earnings to invest in future growth. Besides, if reinvestment opportunities dry up, the company has room to increase the dividend.
We also measure dividends paid against a company's levered free cash flow, to see if enough cash was generated to cover the dividend. Gildan Activewear's cash payout ratio in the last year was 30%, which suggests dividends were well covered by cash generated by the business. It's encouraging to see that the dividend is covered by both profit and cash flow. This generally suggests the dividend is sustainable, as long as earnings don't drop precipitously.
Consider getting our latest analysis on Gildan Activewear's financial position here.
Dividend Volatility
One of the major risks of relying on dividend income, is the potential for a company to struggle financially and cut its dividend. Not only is your income cut, but the value of your investment declines as well - nasty. The first recorded dividend for Gildan Activewear, in the last decade, was nine years ago. Its dividend has not fluctuated much that time, which we like, but we're conscious that the company might not yet have a track record of maintaining dividends in all economic conditions. During the past nine-year period, the first annual payment was US$0.15 in 2010, compared to US$0.54 last year. This works out to be a compound annual growth rate (CAGR) of approximately 15% a year over that time.
Gildan Activewear has been growing its dividend quite rapidly, which is exciting. However, the short payment history makes us question whether this performance will persist across a full market cycle.
Dividend Growth Potential
The other half of the dividend investing equation is evaluating whether earnings per share (EPS) are growing. Growing EPS can help maintain or increase the purchasing power of the dividend over the long run. While there may be fluctuations in the past , Gildan Activewear's earnings per share have basically not grown from where they were five years ago. Flat earnings per share are acceptable for a time, but over the long term, the purchasing power of the company's dividends could be eroded by inflation. A payout ratio below 50% leaves ample room to reinvest in the business, and provides finanical flexibility. Earnings per share growth have grown slowly, which is not great, but if the retained earnings can be reinvested effectively, future growth may be stronger.
Conclusion
Dividend investors should always want to know if a) a company's dividends are affordable, b) if there is a track record of consistent payments, and c) if the dividend is capable of growing. Firstly, we like that Gildan Activewear has low and conservative payout ratios. Second, earnings growth has been ordinary, and its history of dividend payments is shorter than we'd like. Gildan Activewear has a number of positive attributes, but it falls slightly short of our (admittedly high) standards. Were there evidence of a strong moat or an attractive valuation, it could still be well worth a look.
Companies that are growing earnings tend to be the best dividend stocks over the long term. See what the 13 analysts we track are forecasting for Gildan Activewear for free with public analyst estimates for the company.
We have also put together a list of global stocks with a market capitalisation above $1bn and yielding more 3%.
We aim to bring you long-term focused research analysis driven by fundamental data. Note that our analysis may not factor in the latest price-sensitive company announcements or qualitative material.
If you spot an error that warrants correction, please contact the editor at editorial-team@simplywallst.com. This article by Simply Wall St is general in nature. It does not constitute a recommendation to buy or sell any stock, and does not take account of your objectives, or your financial situation. Simply Wall St has no position in the stocks mentioned. Thank you for reading.
