
 Yahoo Finance
 What Can We Make Of Gibson Energy Inc.’s (TSE:GEI) High Return On Capital?

Today we are going to look at Gibson Energy Inc. (TSE:GEI) to see whether it might be an attractive investment prospect. Specifically, we'll consider its Return On Capital Employed (ROCE), since that will give us an insight into how efficiently the business can generate profits from the capital it requires.
First up, we'll look at what ROCE is and how we calculate it. Then we'll compare its ROCE to similar companies. And finally, we'll look at how its current liabilities are impacting its ROCE.
Understanding Return On Capital Employed (ROCE)
ROCE measures the amount of pre-tax profits a company can generate from the capital employed in its business. All else being equal, a better business will have a higher ROCE. In brief, it is a useful tool, but it is not without drawbacks. Renowned investment researcher Michael Mauboussin has suggested that a high ROCE can indicate that 'one dollar invested in the company generates value of more than one dollar'.
So, How Do We Calculate ROCE?
Analysts use this formula to calculate return on capital employed:
Return on Capital Employed = Earnings Before Interest and Tax (EBIT) ÷ (Total Assets - Current Liabilities)
Or for Gibson Energy:
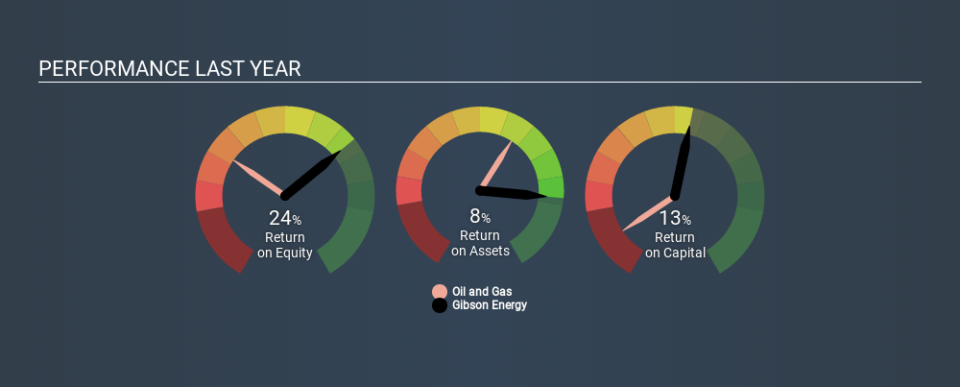
0.13 = CA$317m ÷ (CA$3.3b - CA$956m) (Based on the trailing twelve months to September 2019.)
Therefore, Gibson Energy has an ROCE of 13%.
Check out our latest analysis for Gibson Energy
Is Gibson Energy's ROCE Good?
When making comparisons between similar businesses, investors may find ROCE useful. Gibson Energy's ROCE appears to be substantially greater than the 5.0% average in the Oil and Gas industry. We would consider this a positive, as it suggests it is using capital more effectively than other similar companies. Regardless of where Gibson Energy sits next to its industry, its ROCE in absolute terms appears satisfactory, and this company could be worth a closer look.
Gibson Energy delivered an ROCE of 13%, which is better than 3 years ago, as was making losses back then. That suggests the business has returned to profitability. You can click on the image below to see (in greater detail) how Gibson Energy's past growth compares to other companies.
When considering this metric, keep in mind that it is backwards looking, and not necessarily predictive. ROCE can be deceptive for cyclical businesses, as returns can look incredible in boom times, and terribly low in downturns. ROCE is only a point-in-time measure. Remember that most companies like Gibson Energy are cyclical businesses. Future performance is what matters, and you can see analyst predictions in our free report on analyst forecasts for the company.
How Gibson Energy's Current Liabilities Impact Its ROCE
Short term (or current) liabilities, are things like supplier invoices, overdrafts, or tax bills that need to be paid within 12 months. Due to the way ROCE is calculated, a high level of current liabilities makes a company look as though it has less capital employed, and thus can (sometimes unfairly) boost the ROCE. To counteract this, we check if a company has high current liabilities, relative to its total assets.
Gibson Energy has current liabilities of CA$956m and total assets of CA$3.3b. Therefore its current liabilities are equivalent to approximately 29% of its total assets. Current liabilities are minimal, limiting the impact on ROCE.
Our Take On Gibson Energy's ROCE
With that in mind, Gibson Energy's ROCE appears pretty good. There might be better investments than Gibson Energy out there, but you will have to work hard to find them . These promising businesses with rapidly growing earnings might be right up your alley.
I will like Gibson Energy better if I see some big insider buys. While we wait, check out this free list of growing companies with considerable, recent, insider buying.
If you spot an error that warrants correction, please contact the editor at editorial-team@simplywallst.com. This article by Simply Wall St is general in nature. It does not constitute a recommendation to buy or sell any stock, and does not take account of your objectives, or your financial situation. Simply Wall St has no position in the stocks mentioned.
We aim to bring you long-term focused research analysis driven by fundamental data. Note that our analysis may not factor in the latest price-sensitive company announcements or qualitative material. Thank you for reading.
