
 Yahoo Finance
 General Dynamics (NYSE:GD) Shareholders Have Enjoyed A 59% Share Price Gain

When we invest, we’re generally looking for stocks that outperform the market average. And the truth is, you can make significant gains if you buy good quality businesses at the right price. To wit, the General Dynamics share price has climbed 59% in five years, easily topping the market return of 42% (ignoring dividends).
View our latest analysis for General Dynamics
To paraphrase Benjamin Graham: Over the short term the market is a voting machine, but over the long term it’s a weighing machine. By comparing earnings per share (EPS) and share price changes over time, we can get a feel for how investor attitudes to a company have morphed over time.
During five years of share price growth, General Dynamics achieved compound earnings per share (EPS) growth of 9.9% per year. This EPS growth is remarkably close to the 9.7% average annual increase in the share price. That suggests that the market sentiment around the company hasn’t changed much over that time. Indeed, it would appear the share price is reacting to the EPS.
The image below shows how EPS has tracked over time (if you click on the image you can see greater detail).
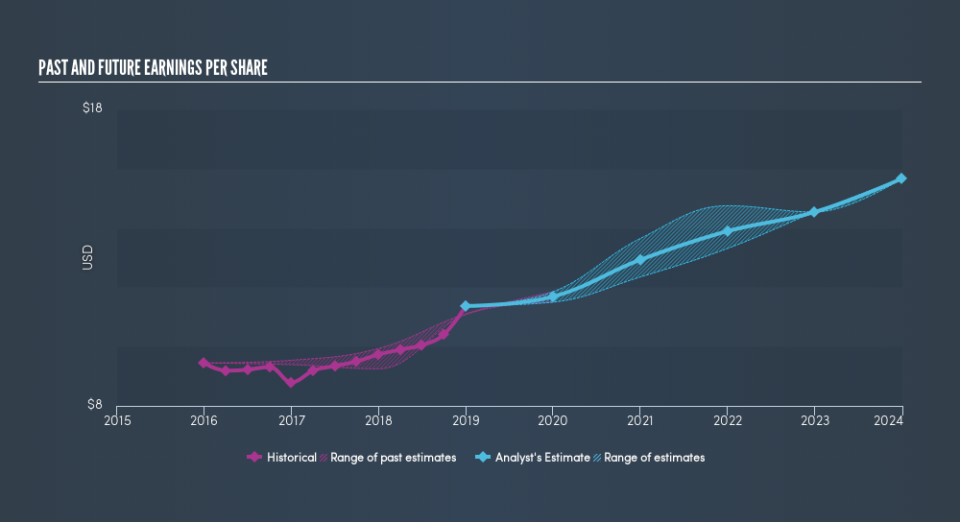
We consider it positive that insiders have made significant purchases in the last year. Having said that, most people consider earnings and revenue growth trends to be a more meaningful guide to the business. Before buying or selling a stock, we always recommend a close examination of historic growth trends, available here..
What About Dividends?
It is important to consider the total shareholder return, as well as the share price return, for any given stock. The TSR incorporates the value of any discounted capital raisings, along with any dividends, based on the assumption that the dividends are reinvested. It’s fair to say that the TSR gives a more complete picture for stocks that pay a dividend. In the case of General Dynamics, it has a TSR of 75% for the last 5 years. That exceeds its share price return that we previously mentioned. And there’s no prize for guessing that the dividend payments largely explain the divergence!
A Different Perspective
General Dynamics shareholders are down 22% for the year (even including dividends), but the market itself is up 3.9%. However, keep in mind that even the best stocks will sometimes underperform the market over a twelve month period. Longer term investors wouldn’t be so upset, since they would have made 12%, each year, over five years. If the fundamental data continues to indicate long term sustainable growth, the current sell-off could be an opportunity worth considering. Investors who like to make money usually check up on insider purchases, such as the price paid, and total amount bought. You can find out about the insider purchases of General Dynamics by clicking this link.
If you like to buy stocks alongside management, then you might just love this free list of companies. (Hint: insiders have been buying them).
Please note, the market returns quoted in this article reflect the market weighted average returns of stocks that currently trade on US exchanges.
We aim to bring you long-term focused research analysis driven by fundamental data. Note that our analysis may not factor in the latest price-sensitive company announcements or qualitative material.
If you spot an error that warrants correction, please contact the editor at editorial-team@simplywallst.com. This article by Simply Wall St is general in nature. It does not constitute a recommendation to buy or sell any stock, and does not take account of your objectives, or your financial situation. Simply Wall St has no position in the stocks mentioned. Thank you for reading.
