
 Yahoo Finance
 Is Gear Energy Ltd.’s (TSE:GXE) 4.7% Return On Capital Employed Good News?

Today we'll evaluate Gear Energy Ltd. (TSE:GXE) to determine whether it could have potential as an investment idea. In particular, we'll consider its Return On Capital Employed (ROCE), as that can give us insight into how profitably the company is able to employ capital in its business.
First, we'll go over how we calculate ROCE. Second, we'll look at its ROCE compared to similar companies. And finally, we'll look at how its current liabilities are impacting its ROCE.
What is Return On Capital Employed (ROCE)?
ROCE measures the amount of pre-tax profits a company can generate from the capital employed in its business. In general, businesses with a higher ROCE are usually better quality. Overall, it is a valuable metric that has its flaws. Author Edwin Whiting says to be careful when comparing the ROCE of different businesses, since 'No two businesses are exactly alike.
How Do You Calculate Return On Capital Employed?
The formula for calculating the return on capital employed is:
Return on Capital Employed = Earnings Before Interest and Tax (EBIT) ÷ (Total Assets - Current Liabilities)
Or for Gear Energy:
0.047 = CA$17m ÷ (CA$379m - CA$19m) (Based on the trailing twelve months to September 2019.)
So, Gear Energy has an ROCE of 4.7%.
Check out our latest analysis for Gear Energy
Is Gear Energy's ROCE Good?
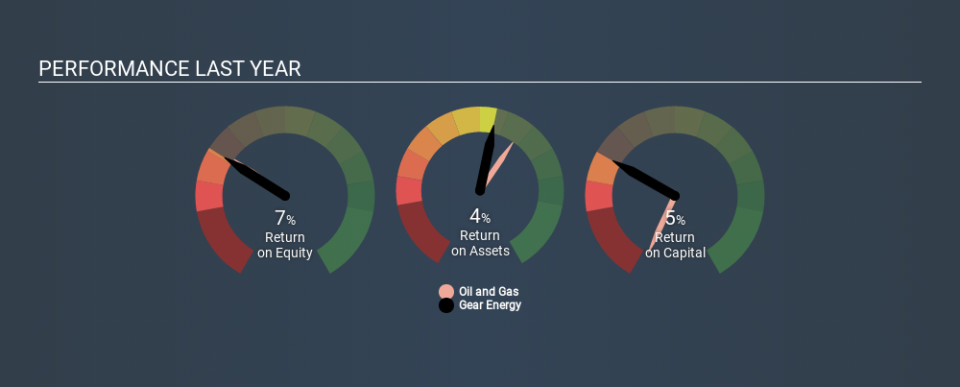
ROCE can be useful when making comparisons, such as between similar companies. It appears that Gear Energy's ROCE is fairly close to the Oil and Gas industry average of 5.4%. Separate from how Gear Energy stacks up against its industry, its ROCE in absolute terms is mediocre; relative to the returns on government bonds. It is possible that there are more rewarding investments out there.
Gear Energy delivered an ROCE of 4.7%, which is better than 3 years ago, as was making losses back then. That implies the business has been improving. You can click on the image below to see (in greater detail) how Gear Energy's past growth compares to other companies.
When considering ROCE, bear in mind that it reflects the past and does not necessarily predict the future. Companies in cyclical industries can be difficult to understand using ROCE, as returns typically look high during boom times, and low during busts. This is because ROCE only looks at one year, instead of considering returns across a whole cycle. Remember that most companies like Gear Energy are cyclical businesses. What happens in the future is pretty important for investors, so we have prepared a free report on analyst forecasts for Gear Energy.
How Gear Energy's Current Liabilities Impact Its ROCE
Short term (or current) liabilities, are things like supplier invoices, overdrafts, or tax bills that need to be paid within 12 months. The ROCE equation subtracts current liabilities from capital employed, so a company with a lot of current liabilities appears to have less capital employed, and a higher ROCE than otherwise. To check the impact of this, we calculate if a company has high current liabilities relative to its total assets.
Gear Energy has total assets of CA$379m and current liabilities of CA$19m. Therefore its current liabilities are equivalent to approximately 5.0% of its total assets. Gear Energy reports few current liabilities, which have a negligible impact on its unremarkable ROCE.
Our Take On Gear Energy's ROCE
Gear Energy looks like an ok business, but on this analysis it is not at the top of our buy list. But note: make sure you look for a great company, not just the first idea you come across. So take a peek at this free list of interesting companies with strong recent earnings growth (and a P/E ratio below 20).
Gear Energy is not the only stock insiders are buying. So take a peek at this free list of growing companies with insider buying.
If you spot an error that warrants correction, please contact the editor at editorial-team@simplywallst.com. This article by Simply Wall St is general in nature. It does not constitute a recommendation to buy or sell any stock, and does not take account of your objectives, or your financial situation. Simply Wall St has no position in the stocks mentioned.
We aim to bring you long-term focused research analysis driven by fundamental data. Note that our analysis may not factor in the latest price-sensitive company announcements or qualitative material. Thank you for reading.
