
 Yahoo Finance
 Should GATX Corporation’s (NYSE:GATX) Recent Earnings Worry You?

When GATX Corporation (NYSE:GATX) released its most recent earnings update (30 June 2018), I compared it against two factor: its historical earnings track record, and the performance of its industry peers on average. Being able to interpret how well GATX has done so far requires weighing its performance against a benchmark, rather than looking at a standalone number at a point in time. In this article, I’ve summarized the key takeaways on how I see GATX has performed.
See our latest analysis for GATX
How GATX fared against its long-term earnings performance and its industry
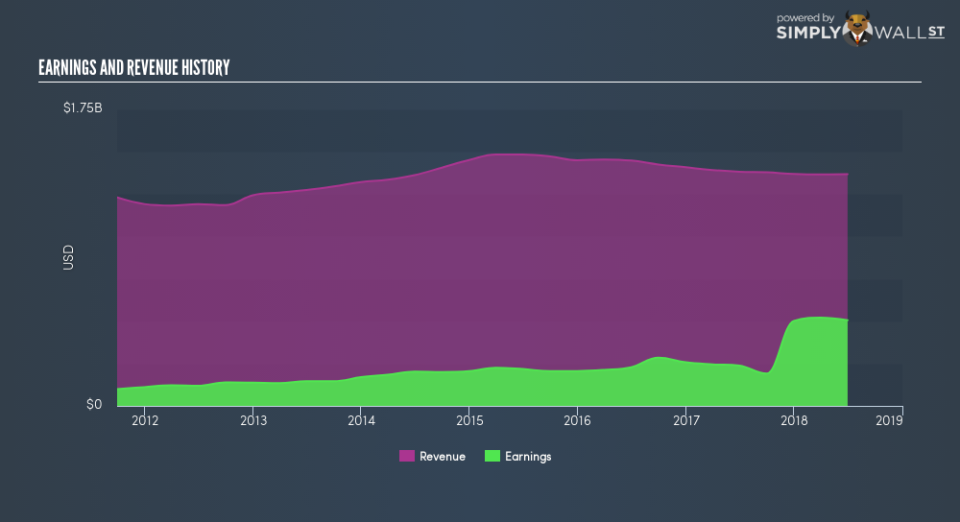
GATX’s trailing twelve-month earnings (from 30 June 2018) of US$506.2m has more than doubled from US$257.1m in the prior year. Furthermore, this one-year growth rate has exceeded its 5-year annual growth average of 20.1%, indicating the rate at which GATX is growing has accelerated. What’s the driver of this growth? Well, let’s take a look at whether it is solely attributable to an industry uplift, or if GATX has seen some company-specific growth.
In the last couple of years, GATX increased its bottom line faster than revenue by effectively controlling its costs. This brought about a margin expansion and profitability over time. Scanning growth from a sector-level, the US trade distributors industry has been increasing average earnings growth of 50.5% in the previous twelve months, and a less exciting 7.2% over the past five. This growth is a median of profitable companies of 25 Trade Distributors companies in US including Taiga Building Products, Beacon Roofing Supply and CCOM Group. This suggests that any tailwind the industry is profiting from, GATX is able to leverage this to its advantage.
In terms of returns from investment, GATX has invested its equity funds well leading to a 27.9% return on equity (ROE), above the sensible minimum of 20%. Furthermore, its return on assets (ROA) of 8.9% exceeds the US Trade Distributors industry of 6.2%, indicating GATX has used its assets more efficiently. However, its return on capital (ROC), which also accounts for GATX’s debt level, has declined over the past 3 years from 3.3% to 2.5%.
What does this mean?
GATX’s track record can be a valuable insight into its earnings performance, but it certainly doesn’t tell the whole story. Positive growth and profitability are what investors like to see in a company’s track record, but how do we properly assess sustainability? You should continue to research GATX to get a better picture of the stock by looking at:
Future Outlook: What are well-informed industry analysts predicting for GATX’s future growth? Take a look at our free research report of analyst consensus for GATX’s outlook.
Financial Health: Are GATX’s operations financially sustainable? Balance sheets can be hard to analyze, which is why we’ve done it for you. Check out our financial health checks here.
Other High-Performing Stocks: Are there other stocks that provide better prospects with proven track records? Explore our free list of these great stocks here.
NB: Figures in this article are calculated using data from the trailing twelve months from 30 June 2018. This may not be consistent with full year annual report figures.
To help readers see past the short term volatility of the financial market, we aim to bring you a long-term focused research analysis purely driven by fundamental data. Note that our analysis does not factor in the latest price-sensitive company announcements.
The author is an independent contributor and at the time of publication had no position in the stocks mentioned. For errors that warrant correction please contact the editor at editorial-team@simplywallst.com.
