
 Yahoo Finance
 Galliford Try Holdings plc's (LON:GFRD) Stock Has Shown A Decent Performance: Have Financials A Role To Play?
Galliford Try Holdings' (LON:GFRD) stock up by 3.1% over the past three months. As most would know, long-term fundamentals have a strong correlation with market price movements, so we decided to look at the company's key financial indicators today to determine if they have any role to play in the recent price movement. In this article, we decided to focus on Galliford Try Holdings' ROE.
ROE or return on equity is a useful tool to assess how effectively a company can generate returns on the investment it received from its shareholders. In short, ROE shows the profit each dollar generates with respect to its shareholder investments.
See our latest analysis for Galliford Try Holdings
How Do You Calculate Return On Equity?
The formula for ROE is:
Return on Equity = Net Profit (from continuing operations) ÷ Shareholders' Equity
So, based on the above formula, the ROE for Galliford Try Holdings is:
11% = UK£14m ÷ UK£127m (Based on the trailing twelve months to December 2022).
The 'return' is the yearly profit. One way to conceptualize this is that for each £1 of shareholders' capital it has, the company made £0.11 in profit.
Why Is ROE Important For Earnings Growth?
Thus far, we have learned that ROE measures how efficiently a company is generating its profits. Based on how much of its profits the company chooses to reinvest or "retain", we are then able to evaluate a company's future ability to generate profits. Assuming everything else remains unchanged, the higher the ROE and profit retention, the higher the growth rate of a company compared to companies that don't necessarily bear these characteristics.
Galliford Try Holdings' Earnings Growth And 11% ROE
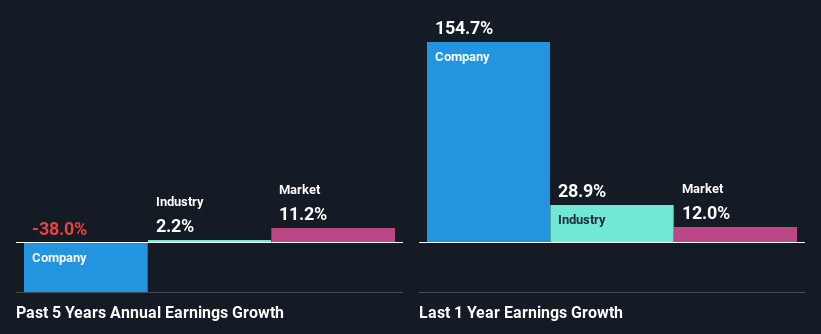
At first glance, Galliford Try Holdings seems to have a decent ROE. And on comparing with the industry, we found that the the average industry ROE is similar at 11%. As you might expect, the 38% net income decline reported by Galliford Try Holdings is a bit of a surprise. We reckon that there could be some other factors at play here that are preventing the company's growth. For example, it could be that the company has a high payout ratio or the business has allocated capital poorly, for instance.
However, when we compared Galliford Try Holdings' growth with the industry we found that while the company's earnings have been shrinking, the industry has seen an earnings growth of 2.2% in the same period. This is quite worrisome.
The basis for attaching value to a company is, to a great extent, tied to its earnings growth. What investors need to determine next is if the expected earnings growth, or the lack of it, is already built into the share price. This then helps them determine if the stock is placed for a bright or bleak future. One good indicator of expected earnings growth is the P/E ratio which determines the price the market is willing to pay for a stock based on its earnings prospects. So, you may want to check if Galliford Try Holdings is trading on a high P/E or a low P/E, relative to its industry.
Is Galliford Try Holdings Efficiently Re-investing Its Profits?
Galliford Try Holdings has a high three-year median payout ratio of 60% (that is, it is retaining 40% of its profits). This suggests that the company is paying most of its profits as dividends to its shareholders. This goes some way in explaining why its earnings have been shrinking. With only a little being reinvested into the business, earnings growth would obviously be low or non-existent. Our risks dashboard should have the 2 risks we have identified for Galliford Try Holdings.
Additionally, Galliford Try Holdings has paid dividends over a period of at least ten years, which means that the company's management is determined to pay dividends even if it means little to no earnings growth. Based on the latest analysts' estimates, we found that the company's future payout ratio over the next three years is expected to hold steady at 50%. Still, forecasts suggest that Galliford Try Holdings' future ROE will rise to 17% even though the the company's payout ratio is not expected to change by much.
Summary
On the whole, we do feel that Galliford Try Holdings has some positive attributes. Yet, the low earnings growth is a bit concerning, especially given that the company has a high rate of return. Investors could have benefitted from the high ROE, had the company been reinvesting more of its earnings. As discussed earlier, the company is retaining a small portion of its profits. With that said, we studied the latest analyst forecasts and found that while the company has shrunk its earnings in the past, analysts expect its earnings to grow in the future. Are these analysts expectations based on the broad expectations for the industry, or on the company's fundamentals? Click here to be taken to our analyst's forecasts page for the company.
Have feedback on this article? Concerned about the content? Get in touch with us directly. Alternatively, email editorial-team (at) simplywallst.com.
This article by Simply Wall St is general in nature. We provide commentary based on historical data and analyst forecasts only using an unbiased methodology and our articles are not intended to be financial advice. It does not constitute a recommendation to buy or sell any stock, and does not take account of your objectives, or your financial situation. We aim to bring you long-term focused analysis driven by fundamental data. Note that our analysis may not factor in the latest price-sensitive company announcements or qualitative material. Simply Wall St has no position in any stocks mentioned.
Join A Paid User Research Session
You’ll receive a US$30 Amazon Gift card for 1 hour of your time while helping us build better investing tools for the individual investors like yourself. Sign up here
