
 Yahoo Finance
 Is Galliford Try Holdings PLC's (LON:GFRD) Stock On A Downtrend As A Result Of Its Poor Financials?
Galliford Try Holdings (LON:GFRD) has had a rough month with its share price down 11%. Given that stock prices are usually driven by a company’s fundamentals over the long term, which in this case look pretty weak, we decided to study the company's key financial indicators. Specifically, we decided to study Galliford Try Holdings' ROE in this article.
Return on equity or ROE is an important factor to be considered by a shareholder because it tells them how effectively their capital is being reinvested. In short, ROE shows the profit each dollar generates with respect to its shareholder investments.
View our latest analysis for Galliford Try Holdings
How To Calculate Return On Equity?
The formula for return on equity is:
Return on Equity = Net Profit (from continuing operations) ÷ Shareholders' Equity
So, based on the above formula, the ROE for Galliford Try Holdings is:
4.2% = UK£5.3m ÷ UK£127m (Based on the trailing twelve months to December 2021).
The 'return' is the income the business earned over the last year. That means that for every £1 worth of shareholders' equity, the company generated £0.04 in profit.
What Has ROE Got To Do With Earnings Growth?
Thus far, we have learned that ROE measures how efficiently a company is generating its profits. We now need to evaluate how much profit the company reinvests or "retains" for future growth which then gives us an idea about the growth potential of the company. Assuming everything else remains unchanged, the higher the ROE and profit retention, the higher the growth rate of a company compared to companies that don't necessarily bear these characteristics.
Galliford Try Holdings' Earnings Growth And 4.2% ROE
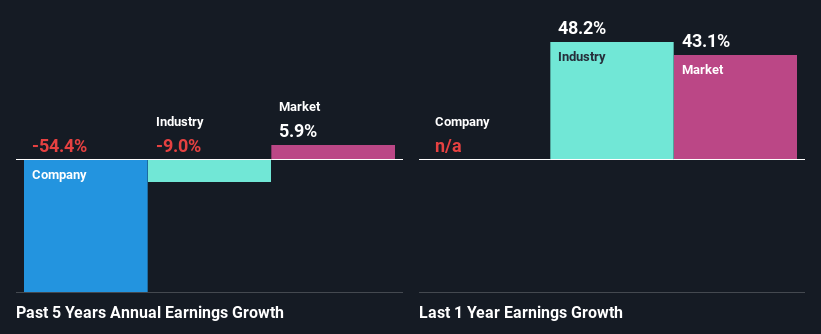
When you first look at it, Galliford Try Holdings' ROE doesn't look that attractive. A quick further study shows that the company's ROE doesn't compare favorably to the industry average of 8.1% either. For this reason, Galliford Try Holdings' five year net income decline of 54% is not surprising given its lower ROE. We believe that there also might be other aspects that are negatively influencing the company's earnings prospects. Such as - low earnings retention or poor allocation of capital.
Furthermore, even when compared to the industry, which has been shrinking its earnings at a rate 9.0% in the same period, we found that Galliford Try Holdings' performance is pretty disappointing, as it suggests that the company has been shrunk its earnings at a rate faster than the industry.
The basis for attaching value to a company is, to a great extent, tied to its earnings growth. It’s important for an investor to know whether the market has priced in the company's expected earnings growth (or decline). This then helps them determine if the stock is placed for a bright or bleak future. If you're wondering about Galliford Try Holdings''s valuation, check out this gauge of its price-to-earnings ratio, as compared to its industry.
Is Galliford Try Holdings Making Efficient Use Of Its Profits?
Galliford Try Holdings' high LTM (or last twelve month) payout ratio of 121% suggests that the company is depleting its resources to keep up its dividend payments, and this shows in its shrinking earnings. Paying a dividend higher than reported profits is not a sustainable move. Our risks dashboard should have the 2 risks we have identified for Galliford Try Holdings.
In addition, Galliford Try Holdings has been paying dividends over a period of at least ten years suggesting that keeping up dividend payments is way more important to the management even if it comes at the cost of business growth. Existing analyst estimates suggest that the company's future payout ratio is expected to drop to 50% over the next three years. As a result, the expected drop in Galliford Try Holdings' payout ratio explains the anticipated rise in the company's future ROE to 15%, over the same period.
Summary
On the whole, Galliford Try Holdings' performance is quite a big let-down. The low ROE, combined with the fact that the company is paying out almost if not all, of its profits as dividends, has resulted in the lack or absence of growth in its earnings. Having said that, looking at current analyst estimates, we found that the company's earnings growth rate is expected to see a huge improvement. To know more about the company's future earnings growth forecasts take a look at this free report on analyst forecasts for the company to find out more.
Have feedback on this article? Concerned about the content? Get in touch with us directly. Alternatively, email editorial-team (at) simplywallst.com.
This article by Simply Wall St is general in nature. We provide commentary based on historical data and analyst forecasts only using an unbiased methodology and our articles are not intended to be financial advice. It does not constitute a recommendation to buy or sell any stock, and does not take account of your objectives, or your financial situation. We aim to bring you long-term focused analysis driven by fundamental data. Note that our analysis may not factor in the latest price-sensitive company announcements or qualitative material. Simply Wall St has no position in any stocks mentioned.
Join A Paid User Research Session
You’ll receive a US$30 Amazon Gift card for 1 hour of your time while helping us build better investing tools for the individual investors like yourself. Sign up here
