
 Yahoo Finance
 The G-III Apparel Group (NASDAQ:GIII) Share Price Is Down 40% So Some Shareholders Are Getting Worried

It's easy to match the overall market return by buying an index fund. But if you buy individual stocks, you can do both better or worse than that. Investors in G-III Apparel Group, Ltd. (NASDAQ:GIII) have tasted that bitter downside in the last year, as the share price dropped 40%. That contrasts poorly with the market return of 3.3%. Notably, shareholders had a tough run over the longer term, too, with a drop of 37% in the last three years. Shareholders have had an even rougher run lately, with the share price down 35% in the last 90 days.
See our latest analysis for G-III Apparel Group
In his essay The Superinvestors of Graham-and-Doddsville Warren Buffett described how share prices do not always rationally reflect the value of a business. One way to examine how market sentiment has changed over time is to look at the interaction between a company's share price and its earnings per share (EPS).
During the unfortunate twelve months during which the G-III Apparel Group share price fell, it actually saw its earnings per share (EPS) improve by 70%. It's quite possible that growth expectations may have been unreasonable in the past. It's fair to say that the share price does not seem to be reflecting the EPS growth. But we might find some different metrics explain the share price movements better.
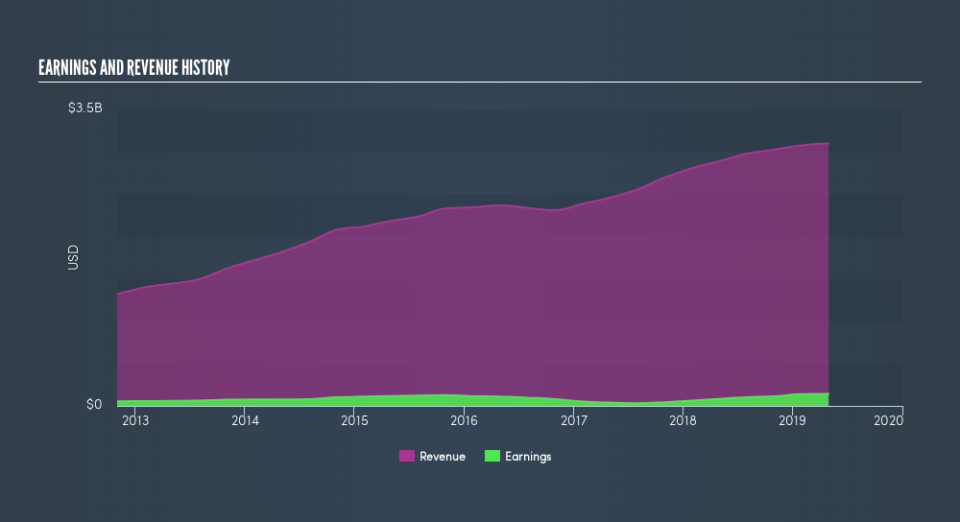
G-III Apparel Group's revenue is actually up 7.2% over the last year. Since the fundamental metrics don't readily explain the share price drop, there might be an opportunity if the market has overreacted.
You can see below how earnings and revenue have changed over time (discover the exact values by clicking on the image).
It's good to see that there was some significant insider buying in the last three months. That's a positive. On the other hand, we think the revenue and earnings trends are much more meaningful measures of the business. You can see what analysts are predicting for G-III Apparel Group in this interactive graph of future profit estimates.
A Different Perspective
While the broader market gained around 3.3% in the last year, G-III Apparel Group shareholders lost 40%. However, keep in mind that even the best stocks will sometimes underperform the market over a twelve month period. Regrettably, last year's performance caps off a bad run, with the shareholders facing a total loss of 8.6% per year over five years. We realise that Buffett has said investors should 'buy when there is blood on the streets', but we caution that investors should first be sure they are buying a high quality businesses. Investors who like to make money usually check up on insider purchases, such as the price paid, and total amount bought. You can find out about the insider purchases of G-III Apparel Group by clicking this link.
There are plenty of other companies that have insiders buying up shares. You probably do not want to miss this free list of growing companies that insiders are buying.
Please note, the market returns quoted in this article reflect the market weighted average returns of stocks that currently trade on US exchanges.
We aim to bring you long-term focused research analysis driven by fundamental data. Note that our analysis may not factor in the latest price-sensitive company announcements or qualitative material.
If you spot an error that warrants correction, please contact the editor at editorial-team@simplywallst.com. This article by Simply Wall St is general in nature. It does not constitute a recommendation to buy or sell any stock, and does not take account of your objectives, or your financial situation. Simply Wall St has no position in the stocks mentioned. Thank you for reading.
