
 Yahoo Finance
 Full Truck Alliance Co. Ltd.'s (NYSE:YMM) Path To Profitability
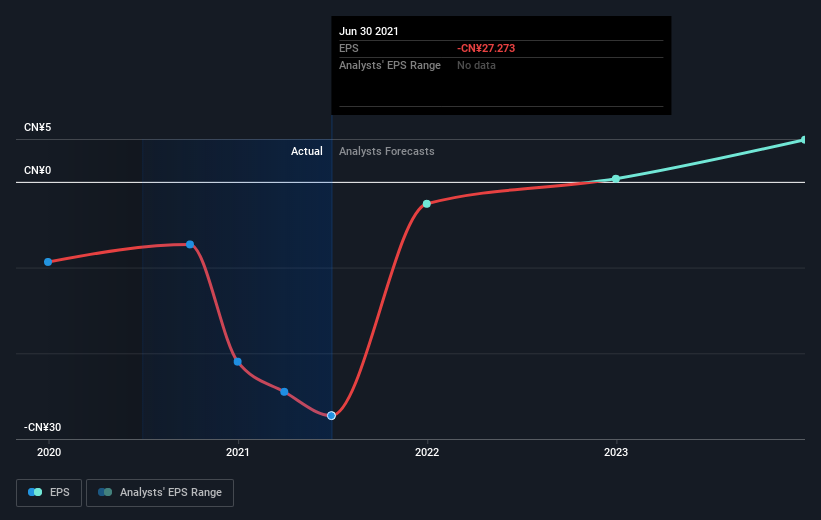
Full Truck Alliance Co. Ltd. (NYSE:YMM) is possibly approaching a major achievement in its business, so we would like to shine some light on the company. Full Truck Alliance Co. Ltd., together with its subsidiaries, operates a digital freight platform that connects shippers with truckers to facilitate shipments across distance ranges, cargo weights, and types in the People’s Republic of China. With the latest financial year loss of CN¥3.6b and a trailing-twelve-month loss of CN¥5.9b, the US$17b market-cap company amplified its loss by moving further away from its breakeven target. As path to profitability is the topic on Full Truck Alliance's investors mind, we've decided to gauge market sentiment. We've put together a brief outline of industry analyst expectations for the company, its year of breakeven and its implied growth rate.
Check out our latest analysis for Full Truck Alliance
According to the 4 industry analysts covering Full Truck Alliance, the consensus is that breakeven is near. They expect the company to post a final loss in 2021, before turning a profit of CN¥449m in 2022. The company is therefore projected to breakeven just over a year from today. How fast will the company have to grow each year in order to reach the breakeven point by 2022? Working backwards from analyst estimates, it turns out that they expect the company to grow 89% year-on-year, on average, which is rather optimistic! If this rate turns out to be too aggressive, the company may become profitable much later than analysts predict.
Given this is a high-level overview, we won’t go into details of Full Truck Alliance's upcoming projects, however, keep in mind that generally a high forecast growth rate is not unusual for a company that is currently undergoing an investment period.
One thing we’d like to point out is that Full Truck Alliance has no debt on its balance sheet, which is rare for a loss-making growth company, which usually has a high level of debt relative to its equity. This means that the company has been operating purely on its equity investment and has no debt burden. This aspect reduces the risk around investing in the loss-making company.
Next Steps:
There are key fundamentals of Full Truck Alliance which are not covered in this article, but we must stress again that this is merely a basic overview. For a more comprehensive look at Full Truck Alliance, take a look at Full Truck Alliance's company page on Simply Wall St. We've also put together a list of essential factors you should further examine:
Valuation: What is Full Truck Alliance worth today? Has the future growth potential already been factored into the price? The intrinsic value infographic in our free research report helps visualize whether Full Truck Alliance is currently mispriced by the market.
Management Team: An experienced management team on the helm increases our confidence in the business – take a look at who sits on Full Truck Alliance’s board and the CEO’s background.
Other High-Performing Stocks: Are there other stocks that provide better prospects with proven track records? Explore our free list of these great stocks here.
This article by Simply Wall St is general in nature. We provide commentary based on historical data and analyst forecasts only using an unbiased methodology and our articles are not intended to be financial advice. It does not constitute a recommendation to buy or sell any stock, and does not take account of your objectives, or your financial situation. We aim to bring you long-term focused analysis driven by fundamental data. Note that our analysis may not factor in the latest price-sensitive company announcements or qualitative material. Simply Wall St has no position in any stocks mentioned.
Have feedback on this article? Concerned about the content? Get in touch with us directly. Alternatively, email editorial-team (at) simplywallst.com.
