
 Yahoo Finance
 Fresenius SE KGaA (ETR:FRE) Will Be Hoping To Turn Its Returns On Capital Around
What are the early trends we should look for to identify a stock that could multiply in value over the long term? Amongst other things, we'll want to see two things; firstly, a growing return on capital employed (ROCE) and secondly, an expansion in the company's amount of capital employed. Ultimately, this demonstrates that it's a business that is reinvesting profits at increasing rates of return. Although, when we looked at Fresenius SE KGaA (ETR:FRE), it didn't seem to tick all of these boxes.
Return On Capital Employed (ROCE): What Is It?
If you haven't worked with ROCE before, it measures the 'return' (pre-tax profit) a company generates from capital employed in its business. Analysts use this formula to calculate it for Fresenius SE KGaA:
Return on Capital Employed = Earnings Before Interest and Tax (EBIT) ÷ (Total Assets - Current Liabilities)
0.059 = €3.7b ÷ (€76b - €14b) (Based on the trailing twelve months to June 2022).
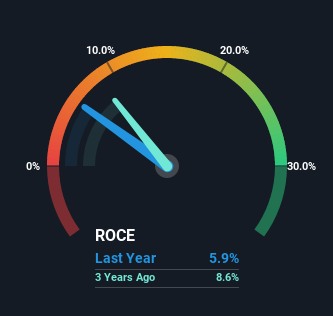
Thus, Fresenius SE KGaA has an ROCE of 5.9%. On its own that's a low return on capital but it's in line with the industry's average returns of 5.7%.
View our latest analysis for Fresenius SE KGaA
In the above chart we have measured Fresenius SE KGaA's prior ROCE against its prior performance, but the future is arguably more important. If you'd like to see what analysts are forecasting going forward, you should check out our free report for Fresenius SE KGaA.
So How Is Fresenius SE KGaA's ROCE Trending?
In terms of Fresenius SE KGaA's historical ROCE movements, the trend isn't fantastic. Over the last five years, returns on capital have decreased to 5.9% from 11% five years ago. However it looks like Fresenius SE KGaA might be reinvesting for long term growth because while capital employed has increased, the company's sales haven't changed much in the last 12 months. It's worth keeping an eye on the company's earnings from here on to see if these investments do end up contributing to the bottom line.
What We Can Learn From Fresenius SE KGaA's ROCE
In summary, Fresenius SE KGaA is reinvesting funds back into the business for growth but unfortunately it looks like sales haven't increased much just yet. And investors appear hesitant that the trends will pick up because the stock has fallen 64% in the last five years. On the whole, we aren't too inspired by the underlying trends and we think there may be better chances of finding a multi-bagger elsewhere.
On a final note, we've found 1 warning sign for Fresenius SE KGaA that we think you should be aware of.
For those who like to invest in solid companies, check out this free list of companies with solid balance sheets and high returns on equity.
Have feedback on this article? Concerned about the content? Get in touch with us directly. Alternatively, email editorial-team (at) simplywallst.com.
This article by Simply Wall St is general in nature. We provide commentary based on historical data and analyst forecasts only using an unbiased methodology and our articles are not intended to be financial advice. It does not constitute a recommendation to buy or sell any stock, and does not take account of your objectives, or your financial situation. We aim to bring you long-term focused analysis driven by fundamental data. Note that our analysis may not factor in the latest price-sensitive company announcements or qualitative material. Simply Wall St has no position in any stocks mentioned.
Join A Paid User Research Session
You’ll receive a US$30 Amazon Gift card for 1 hour of your time while helping us build better investing tools for the individual investors like yourself. Sign up here
