Freeport (FCX) Beats Earnings and Revenue Estimates in Q3
Freeport-McMoRan Inc. FCX reported net income (attributable to common stock) of 38 cents per share in third-quarter 2018, up from 19 cents in the year-ago quarter.
Barring one-time items, adjusted earnings came in at 35 cents per share in the quarter, which beat the Zacks Consensus Estimate of 33 cents.
Revenues went up around 13.9% year over year to $4,908 million. Also, the figure surpassed the Zacks Consensus Estimate of $4,379.7 million.
Consolidated sales from mines totaled 1.04 billion pounds of copper, 837,000 ounces of gold and 22 million pounds of molybdenum. Copper sales volume rose 8% year over year, mainly reflecting higher ore grades and higher operating rates in Indonesia.
Per the company, third-quarter results reflect continued focus on productivity, capital discipline and cost management.
Freeport-McMoRan Inc. Price, Consensus and EPS Surprise

Freeport-McMoRan Inc. Price, Consensus and EPS Surprise | Freeport-McMoRan Inc. Quote
Operational Update
Consolidated average unit net cash costs of 93 cents per pound of copper were lower than $1.20 reported in the year-ago quarter.
Average realized price for copper was $2.80 per pound, down up from $2.95 in the prior-year quarter. Average realized price per ounce for gold fell to $1,191 from $1,290 in the year-ago quarter, while average realized price per pound for molybdenum was $12.40 per pound.
Mining Update
North America Copper Mines: Copper sales rose 0.9% year over year to 350 million pounds. Production fell 6.9% to 349 million pounds.
Freeport expects copper sales from North America to be 1.4 billion pounds in 2018 compared with 1.5 billion pounds in 2017.
South America Mining: Copper sales were 326 million pounds in the quarter, down from 327 million pounds logged in the year-ago quarter.
Freeport expects South America mining to report sales of around 1.2 billion pounds of copper in 2018.
Indonesia Mining: Copper sales of 368 million pounds, rose from 258 million pounds in the year-ago quarter.
Gold sales increased to 831,000 ounces from 352,000 ounces in the year-ago quarter, while production improved nearly two-folds to 754,000 ounces in the quarter.
Sales from Indonesia mining are anticipated to be about 1.16 billion pounds of copper and 2.45 million ounces of gold for 2018 compared with 1 billion pounds of copper and 1.5 million ounces of gold for 2017.
Molybdenum Mines: Molybdenum production was 8 million pounds in the third quarter, unchanged from year-ago quarter’s tally.
Financial Position
Freeport’s operating cash flows totaled roughly $1.25 billion in the quarter and $3.9 billion for the first nine months.
The company had total debt (including current) of $11.1 billion as of Sep 30, 2018, down from roughly $12.6 billion as of Sep 30, 2017.
Guidance
Freeport anticipates consolidated sales volumes for 2018 to be roughly 3.8 billion pounds of copper, 2.45 million ounces of gold and 95 million pounds of molybdenum, including 790 million pounds of copper, 330,000 ounces of gold and 25 million pounds of molybdenum for fourth-quarter 2018.
For 2018, the company expects operating cash flows to be roughly $4.2 billion. Capital expenditures are expected to be around $2 billion, which includes $1.2 billion for major mining projects mainly related to underground development in the Grasberg and the Lone Star oxide project.
Price Performance
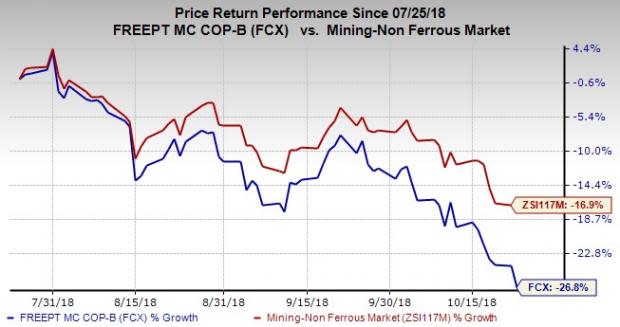
Freeport’s shares have lost 26.8% in the past three months compared with the industry’s 16.9% decline.

Zacks Rank & Stocks to Consider
Freeport currently carries a Zacks Rank #3 (Hold).
A few better-ranked stocks in the basic materials space are Methanex Corporation MEOH, KMG Chemicals, Inc. KMG and CF Industries Holdings, Inc. CF, each sporting a Zacks Rank #1 (Strong Buy). You can see the complete list of today’s Zacks #1 Rank stocks here.
Methanex has expected long-term earnings growth rate of 15%. Its shares have surged 36.4% in the past year.
KMG Chemicals has expected long-term earnings growth rate of 28.5%. Its shares have rallied 37.9% in the past year.
CF Industries has expected long-term earnings growth rate of 6%. Its shares have gained 25.2% in a year.
Will You Make a Fortune on the Shift to Electric Cars?
Here's another stock idea to consider. Much like petroleum 150 years ago, lithium power may soon shake the world, creating millionaires and reshaping geo-politics. Soon electric vehicles (EVs) may be cheaper than gas guzzlers. Some are already reaching 265 miles on a single charge.
With battery prices plummeting and charging stations set to multiply, one company stands out as the #1 stock to buy according to Zacks research.
It's not the one you think.
See This Ticker Free >>
Want the latest recommendations from Zacks Investment Research? Today, you can download 7 Best Stocks for the Next 30 Days. Click to get this free report
Methanex Corporation (MEOH) : Free Stock Analysis Report
KMG Chemicals, Inc. (KMG) : Free Stock Analysis Report
CF Industries Holdings, Inc. (CF) : Free Stock Analysis Report
Freeport-McMoRan Inc. (FCX) : Free Stock Analysis Report
To read this article on Zacks.com click here.
Zacks Investment Research

 Yahoo Finance
