Franco-Nevada (FNV) Q4 Earnings Top Estimates, Revenues Dip Y/Y
Franco-Nevada Corporation FNV reported adjusted earnings of 86 cents per share in fourth-quarter 2022, in line with the prior-year quarter. The bottom line surpassed the Zacks Consensus Estimate of 85 cents.
The company generated revenues of $320 million in the reported quarter, marking a year-over-year decline of 2.4%. The downside was mainly driven by lower contributions from Precious Metal and Iron Ore assets, offset by the company’s Energy assets due to higher realized oil and gas prices. During the December-end quarter, 70.7% of revenues were sourced from Precious Metal assets (55.6% gold, 10.2% silver and 4.9% platinum group metals).
The company sold 129,642 Gold Equivalent Ounces (GEOs) from precious metal assets in the reported quarter, down 6.6% from the prior-year quarter. FNV sold 183,886 GEOs (including Energy), up 1% from the prior-year quarter.
In the reported quarter, adjusted EBITDA was down 2.7% year over year to $262.4 million.
Franco-Nevada Corporation Price, Consensus and EPS Surprise
Franco-Nevada Corporation price-consensus-eps-surprise-chart | Franco-Nevada Corporation Quote
Financial Position
The company had $1,196.5 million cash in hand at the end of 2022, up from $539.3 million as of the end of 2021. It recorded an operating cash flow of $999.5 million in 2022, up from the $955.4 million witnessed in 2021.
Franco-Nevada is debt-free and uses its free cash flow to expand the portfolio and payout dividends. FNV now has available capital of $2.2 billion.
2022 Results
Franco-Nevada reported record adjusted EPS of $3.64 in 2022 compared with $3.52 in the prior year. Yearly earnings beat the Zacks Consensus Estimate of $3.63.
Sales were up 1.2% year over year to a record $1.32 billion. Revenues were in line with the Zacks Consensus Estimate.
Guidance
Franco-Nevada expects total GEOs between 640,000 and 700,000 in 2023, a decrease from that reported in 2022. Of this, GEOs from precious metal assets are expected between 490,000 and 530,000 GEOs, in line with the 2022 guidance. The outlook reflects an expected lower oil and gas prices.
Price Performance
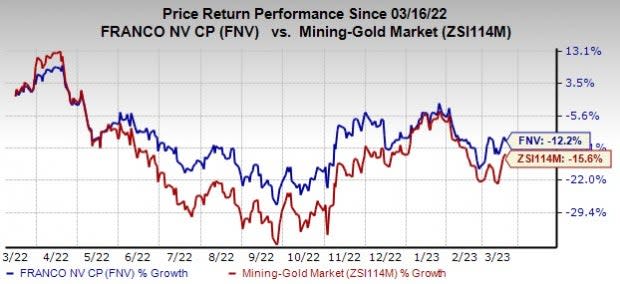
Franco-Nevada’s shares have lost 12.2% in the past year compared with the industry’s decline of 15.6%.

Image Source: Zacks Investment Research
Zacks Rank & Stocks to Consider
Franco-Nevada currently carries a Zacks Rank #3 (Hold).
Some better-ranked stocks in the basic materials space are CalMaine Foods, Inc. CALM, Reliance Steel & Aluminum Co. RS and Carpenter Technology Corporation CRS. CALM and RS currently flaunt a Zacks Rank #1 (Strong Buy) and CRS carries a Zacks Rank #2 (Buy). You can see the complete list of today’s Zacks #1 Rank stocks here.
The Zacks Consensus Estimate for CalMaine Foods’ fiscal 2023 earnings per share is pegged at $16.75, suggesting 515.8% growth from the year-ago reported figure. The consensus estimate for fiscal 2023 has moved 106.8% north in the past 60 days. CALM has a trailing four-quarter earnings surprise of 15.3%, on average. Its shares have gained 13.7% in the past year.
The Zacks Consensus Estimate for Reliance Steel’s earnings per share is pegged at $21.41 for 2023. Earnings estimates have been revised 19% upward in the past 60 days. RS has a trailing four-quarter average surprise of 13.4%, on average. The company has gained 27.7% in a year.
The Zacks Consensus Estimate for Carpenter Technology’s fiscal 2023 earnings per share is pegged at $1.05, suggesting 199.1% growth from the year-ago reported figure. CRS has a trailing four-quarter earnings surprise of 33.6%, on average. Its shares have gained 13% in the past year.
Want the latest recommendations from Zacks Investment Research? Today, you can download 7 Best Stocks for the Next 30 Days. Click to get this free report
Reliance Steel & Aluminum Co. (RS) : Free Stock Analysis Report
Cal-Maine Foods, Inc. (CALM) : Free Stock Analysis Report
Carpenter Technology Corporation (CRS) : Free Stock Analysis Report
Franco-Nevada Corporation (FNV) : Free Stock Analysis Report

 Yahoo Finance