
 Yahoo Finance
 What Can We Make Of Franco-Nevada Corporation’s (TSE:FNV) High Return On Capital?

Today we are going to look at Franco-Nevada Corporation (TSE:FNV) to see whether it might be an attractive investment prospect. Specifically, we’ll consider its Return On Capital Employed (ROCE), since that will give us an insight into how efficiently the business can generate profits from the capital it requires.
First of all, we’ll work out how to calculate ROCE. Next, we’ll compare it to others in its industry. Then we’ll determine how its current liabilities are affecting its ROCE.
Understanding Return On Capital Employed (ROCE)
ROCE is a measure of a company’s yearly pre-tax profit (its return), relative to the capital employed in the business. In general, businesses with a higher ROCE are usually better quality. Ultimately, it is a useful but imperfect metric. Renowned investment researcher Michael Mauboussin has suggested that a high ROCE can indicate that ‘one dollar invested in the company generates value of more than one dollar’.
How Do You Calculate Return On Capital Employed?
The formula for calculating the return on capital employed is:
Return on Capital Employed = Earnings Before Interest and Tax (EBIT) ÷ (Total Assets – Current Liabilities)
Or for Franco-Nevada:
0.056 = US$269m ÷ (US$4.8b – US$23m) (Based on the trailing twelve months to September 2018.)
Therefore, Franco-Nevada has an ROCE of 5.6%.
View our latest analysis for Franco-Nevada
Is Franco-Nevada’s ROCE Good?
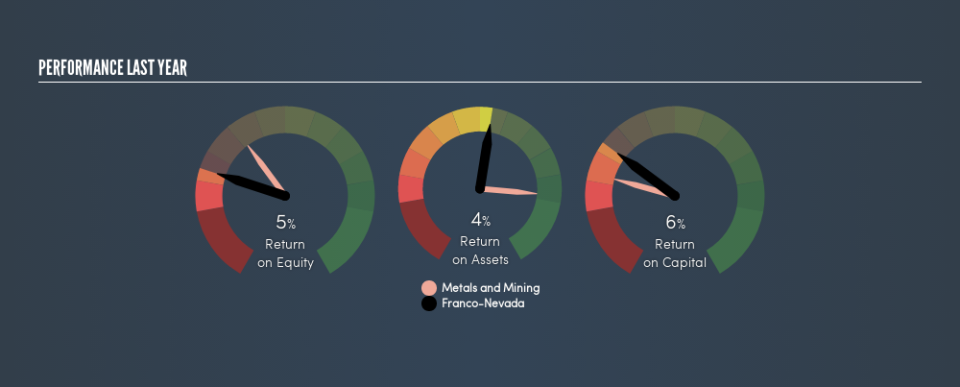
When making comparisons between similar businesses, investors may find ROCE useful. In our analysis, Franco-Nevada’s ROCE is meaningfully higher than the 2.3% average in the Metals and Mining industry. We consider this a positive sign, because it suggests it uses capital more efficiently than similar companies. Setting aside the industry comparison for now, Franco-Nevada’s ROCE is mediocre in absolute terms, considering the risk of investing in stocks versus the safety of a bank account. Investors may wish to consider higher-performing investments.
As we can see, Franco-Nevada currently has an ROCE of 5.6% compared to its ROCE 3 years ago, which was 3.1%. This makes us wonder if the company is improving.
When considering ROCE, bear in mind that it reflects the past and does not necessarily predict the future. ROCE can be misleading for companies in cyclical industries, with returns looking impressive during the boom times, but very weak during the busts. ROCE is only a point-in-time measure. Remember that most companies like Franco-Nevada are cyclical businesses. Future performance is what matters, and you can see analyst predictions in our free report on analyst forecasts for the company.
Do Franco-Nevada’s Current Liabilities Skew Its ROCE?
Liabilities, such as supplier bills and bank overdrafts, are referred to as current liabilities if they need to be paid within 12 months. Due to the way ROCE is calculated, a high level of current liabilities makes a company look as though it has less capital employed, and thus can (sometimes unfairly) boost the ROCE. To counteract this, we check if a company has high current liabilities, relative to its total assets.
Franco-Nevada has total assets of US$4.8b and current liabilities of US$23m. As a result, its current liabilities are equal to approximately 0.5% of its total assets. With low levels of current liabilities, at least Franco-Nevada’s mediocre ROCE is not unduly boosted.
What We Can Learn From Franco-Nevada’s ROCE
Franco-Nevada looks like an ok business, but on this analysis it is not at the top of our buy list. Of course, you might find a fantastic investment by looking at a few good candidates. So take a peek at this free list of companies with modest (or no) debt, trading on a P/E below 20.
If you are like me, then you will not want to miss this free list of growing companies that insiders are buying.
We aim to bring you long-term focused research analysis driven by fundamental data. Note that our analysis may not factor in the latest price-sensitive company announcements or qualitative material.
If you spot an error that warrants correction, please contact the editor at editorial-team@simplywallst.com. This article by Simply Wall St is general in nature. It does not constitute a recommendation to buy or sell any stock, and does not take account of your objectives, or your financial situation. Simply Wall St has no position in the stocks mentioned. Thank you for reading.
