
 Yahoo Finance
 Four Days Left To Buy SB Financial Group, Inc. (NASDAQ:SBFG) Before The Ex-Dividend Date
SB Financial Group, Inc. (NASDAQ:SBFG) is about to trade ex-dividend in the next four days. The ex-dividend date occurs one day before the record date which is the day on which shareholders need to be on the company's books in order to receive a dividend. The ex-dividend date is an important date to be aware of as any purchase of the stock made on or after this date might mean a late settlement that doesn't show on the record date. Therefore, if you purchase SB Financial Group's shares on or after the 11th of May, you won't be eligible to receive the dividend, when it is paid on the 26th of May.
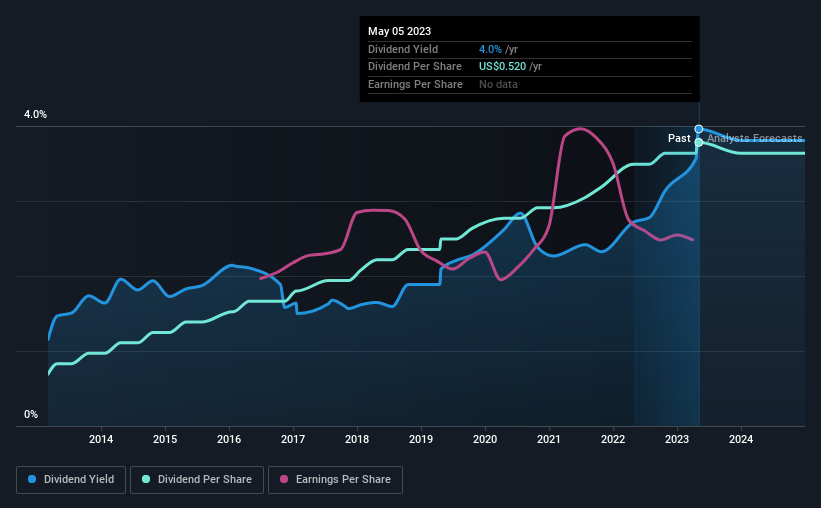
The company's next dividend payment will be US$0.13 per share. Last year, in total, the company distributed US$0.50 to shareholders. Last year's total dividend payments show that SB Financial Group has a trailing yield of 4.0% on the current share price of $13.13. Dividends are a major contributor to investment returns for long term holders, but only if the dividend continues to be paid. As a result, readers should always check whether SB Financial Group has been able to grow its dividends, or if the dividend might be cut.
Check out our latest analysis for SB Financial Group
If a company pays out more in dividends than it earned, then the dividend might become unsustainable - hardly an ideal situation. That's why it's good to see SB Financial Group paying out a modest 28% of its earnings.
Generally speaking, the lower a company's payout ratios, the more resilient its dividend usually is.
Click here to see how much of its profit SB Financial Group paid out over the last 12 months.
Have Earnings And Dividends Been Growing?
Companies with falling earnings are riskier for dividend shareholders. If earnings fall far enough, the company could be forced to cut its dividend. That's why it's not ideal to see SB Financial Group's earnings per share have been shrinking at 2.6% a year over the previous five years.
Another key way to measure a company's dividend prospects is by measuring its historical rate of dividend growth. SB Financial Group has delivered 19% dividend growth per year on average over the past 10 years.
Final Takeaway
Is SB Financial Group an attractive dividend stock, or better left on the shelf? Earnings per share have shrunk noticeably in recent years, although we like that the company has a low payout ratio. This could suggest a cut to the dividend may not be a major risk in the near future. We think there are likely better opportunities out there.
If you want to look further into SB Financial Group, it's worth knowing the risks this business faces. For example, SB Financial Group has 2 warning signs (and 1 which is significant) we think you should know about.
A common investing mistake is buying the first interesting stock you see. Here you can find a full list of high-yield dividend stocks.
Have feedback on this article? Concerned about the content? Get in touch with us directly. Alternatively, email editorial-team (at) simplywallst.com.
This article by Simply Wall St is general in nature. We provide commentary based on historical data and analyst forecasts only using an unbiased methodology and our articles are not intended to be financial advice. It does not constitute a recommendation to buy or sell any stock, and does not take account of your objectives, or your financial situation. We aim to bring you long-term focused analysis driven by fundamental data. Note that our analysis may not factor in the latest price-sensitive company announcements or qualitative material. Simply Wall St has no position in any stocks mentioned.
Join A Paid User Research Session
You’ll receive a US$30 Amazon Gift card for 1 hour of your time while helping us build better investing tools for the individual investors like yourself. Sign up here
