
 Yahoo Finance
 Forex Daily Recap – USD/CAD Slipped as Loonie Rose over Upbeat Data
USD/CAD
The Loonie pair was underway strong downtrend on Friday. Quite remarkably, the pair broke two significant support handles stalled near 1.3196 and 1.3185 levels. Even the Ichimoku Clouds continued to hover above the USD/CAD pair, cheering the bears.
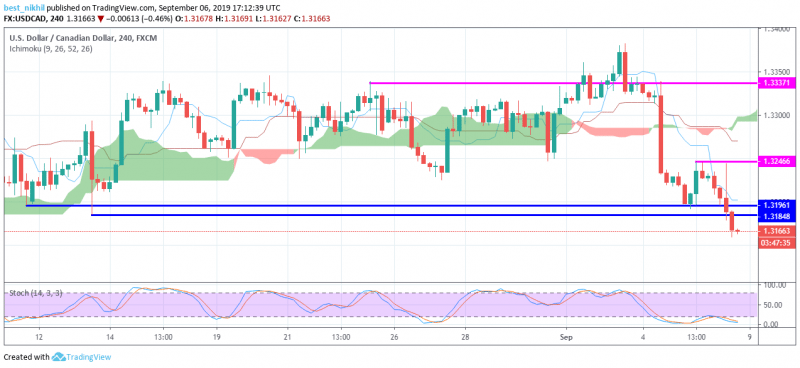
Today’s strong negative trend came following an abrupt rise in the Canadian currency value. Notably, the Canadian Jobs data reported upbeat data, pleasing the CAD traders. However, as per the law, with a rise in the CAD, the overall USD/CAD pair underwent sharp plunges. The August Net Change in Employment reported a whopping 81.1K over the 15.0K consensus estimate. Meantime, the Unemployment rate continued to stay near 5.7% in-line with the previous as well as forecast. Other noteworthy data releases that caught market attention were the August Participation rate, YoY Average Hourly Wages, and Ivey PMI data release.
Traders must also focus over the Stochastic Oscillator that has almost reached near 0.0 mark, revealing massive selling or oversold condition.
On the contrary, if the pair had moved to the upper side, then that would have triggered the resistance points stemmed near 1.3247 and 1.3337 levels.
EUR/USD
The Fiber attempted to jump in the earlier hours. Anyhow, the underlying 50-day SMA ensured to limit the pair’s daily losses. As the day was approaching closing, the EUR/USD pair had hardly moved away from the opening mark. Meanwhile, the ability to move to the north-side would have opened fresh challenge over the 1.1052 resistance handle. Even if the pair had moved above the aforementioned resistance, then the pair would have encountered another set of resistance cluster. This cluster comprised of a major overhead counter-trendline and significant SMAs.
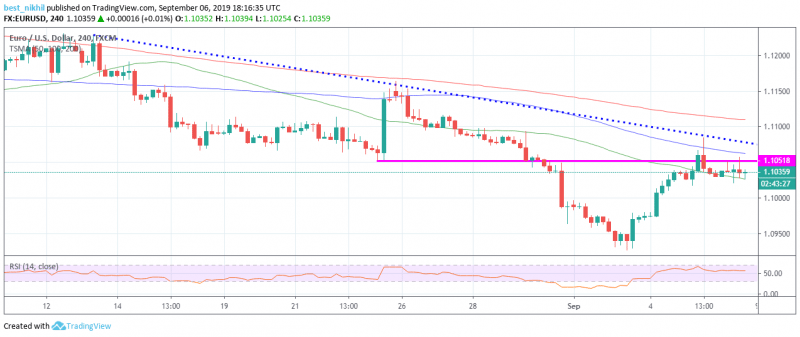
Somehow, the Relative Strength Index (RSI) continued to stay flat near 50 level, showing a lack of interest among the market participants.
Noticeably, the highly critical Eurozone Q2 GDP figure remained in-line with 0.2% market expectations. Also, the Eurozone Q2 YoY Employment Change came out 1.2%, 0.1% higher than the estimate, and 0.2% lower than the previous 1.4%.
USD Index
After hitting the upper boundary of the Bollinger bands on Sept 3, the US Dollar Index took a rebound price action to the south side. Even today, the Greenback was underway the same tumbling rally. However, the USD Index bears seemed to halt near the center line without moving into the lower region of the Bollinger Bands. Nevertheless, any movement of that kind would have triggered for a strong downtrend, shedding most of the previously attained gains.

On the economic event side, the August YoY Average Hourly Earnings rose 0.1% above the 3.1% market hopes. Somehow, the market seemed to ignore this upbeat data and focus over the downbeat August Non-Farm Payrolls. Notably, the Payrolls came out 130K, below the 158K market estimate. Interim, the Unemployment Rate remained in-line with the previous 3.7% statistics.
USD/JPY
After testing the overhead 50-day SMA last day, the Ninja took a U-turn to the downside.

Even if the pair had breached above the aforementioned handle, then that would have activated the overhead 100-day and 200-day SMA. Earlier the day, the Japanese July Leading Economic Index reported 93.6 points the same as the last recorded data.
This article was originally posted on FX Empire
More From FXEMPIRE:
Negative Week for Grain Prices Due to Weather and Optimism in Trade
AUD/USD Weekly Price Forecast – Australian dollar rallies for the week
U.S. Dollar Index Futures (DX) Technical Analysis – Powell’s Positive Comments Fuel Rebound Rally
Oil Price Fundamental Daily Forecast – Traders Pinning Hopes on Trade Dispute Resolution
Forex Daily Recap – USD/CAD Slipped as Loonie Rose over Upbeat Data
